GPSLog Labs Blog

GPSLog Labs Blog

New features and tips for using gpsloglabs.com

Updates for March 28th

  • Florian is doing a great job translating the site into German, danke schön!
    Ampelmann_normal
  • The Summary tab on a tag detail page will show a table breaking down the activity for that tag by other tags where appropriate:
    Screenshot-tag-pivot
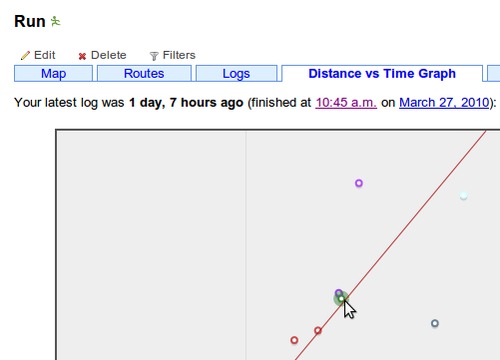
  • The Distance vs Time graph on a tag detail page now shows a line through the mouse position that let's you see at a glance which logs are faster, slower or the same speed:
  • Table rows are now highlighted as you hover the mouse over them.
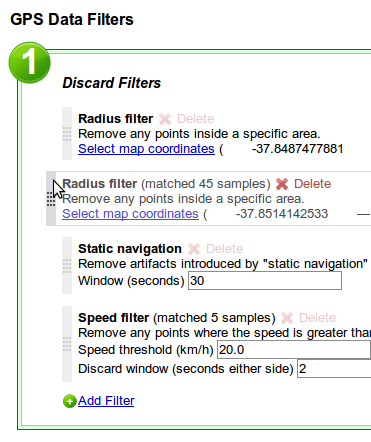
  • GPS Data Filter editing has been improved to make it more obvious that the items can be dragged to re-arrange the order that they are applied:
    Screenshot-filter-reorder
Filed under  //  changelog   filters   tags   translation  

OpenStreetMap tiles

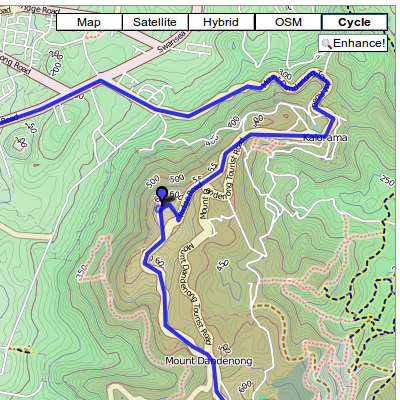
You can choose what kind of map you want to display on the GPSLog Labs maps as they now support the OpenStreetMap and OpenStreetMap bicycle map tiles.

Screenshot-osm-map-tiles

This should help those of you in parts of the world not covered very well by the Google Maps, and with OpenStreetMap, if there's something not quite right, you can upload your GPS file and make the map better.

The bicycle maps include lots of features to help you out if your a cyclist, including parking, bike lanes and contour lines and colouring to indicate hills.

Filed under  //  bicycle   changelog   maps   openstreetmap   osm  

Updates for March 8th

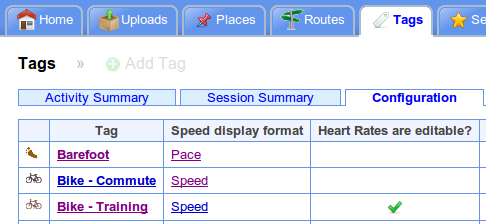
  • Selection of whether speeds are displayed as speed (km/h or mph) or as pace (minutes per km or mile) is now done on the tag page:
    Screenshot-tag-configuration

    There was a good reason for it being on the Settings page previously, but I've forgotten what it was...

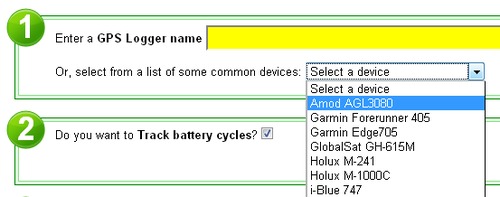
  • There's a list of some of the most common GPS logging devices to choose from when you add a new device. Many more that aren't on the list work with GPSLog Labs, so you can still enter your own device name if you need to.
  • The algorithm used to determine the amount of ascending and descending distance/duration for your activity has been fine tuned. It is more accurate now, using a line of best fit through 7 samples and considers anything greater than a 2.5% grade to be a hill. The grade histograms have also been extended to show up to a 40% grade, have fun climbing that!
Filed under  //  changelog   devices   tags  

Heart rate logging

Support for heart rate logging in GPSLog Labs has been added for Garmin devices that use the Garmin Training Center format (i.e. .TCX files).

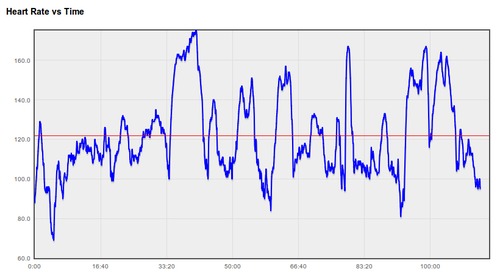
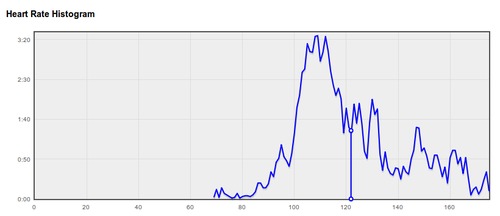
You can see graphs of your Heart Rate vs Time and a histogram of your heart rate on the activity detail page:

Heart rates will be repeated to fill in gaps if the readings occur less than once per second, up to a maximum of 5 minutes.

If you have a device that logs heart rates, and the graphs aren't showing up in GPSLog Labs, please let me know and I'll add support for it.

Note that this will only work for logs out doors where a latitude and longitude is recorded with the heart rate, so if you're using something like a Garmin EDGE705 in indoor mode, you won't be able to view your activity or heart rates.

If you don't have a GPS logger that records your heart rate at each point, you can still record average and maximum heart rates against your activity manually (i.e. based on a non-logging heart rate monitor strap.)

To switch heart rates on manually:

  1. Go to tags, and select a tag you want to record heart rates for (e.g. Running or Bike)
  2. Edit the tag, click the "Edit heart rates" checkbox.
  3. Now, when you go to activity tagged with that tag, you'll see the "heart rate" tab (this usually only shows up if your logger supports heart rates.)
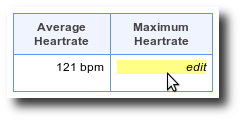
  4. On that tab, the average and maximum heart rate values will show "edit", click that, type in the heart rate and click the save button.
    Heart_manual_1

Once the system has heart rates recorded against your activity (either automatically or entered manually) they will show up in summary and comparison tables and graphs for routes and tags.

Filed under  //  changelog   devices   graphs   heartrate  

Updates for February 25th

This series of GPSLog Labs updates focused on reducing the amount of clutter on the pages and providing a single place for each function.

Home page

  • The "This Week's Activity" totals have been moved to the Reports | Trends page.
  • Goal progress for the week has been moved to the Goals page.

Uploaded Log Files page

  • The list of uploaded log files has been pared down to two columns and now indicates whether places have been matched successfully with an icon next to the file-name.

    The icon will go green to indicate that the log has been chopped cleanly:

    Screenshot-inbox-layout-status

    The old "quick edit" functionality will reappear in another incarnation sometime in the future.

Editing Processed Activity for a Log File

  • The Activity column now incorporates a summary of the activity and the Route, Tag and Notes editing have been moved out of main interface. You can still add Routes and Tags, but editing is now done on the Activity detail page.

Activity Detail page

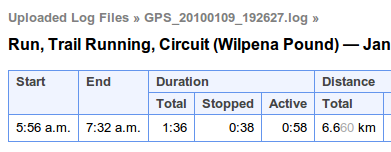
  • The drop-down menu has been removed and the page heading and "bread crumbs" simplified:
    Screenshot-log-detail-0
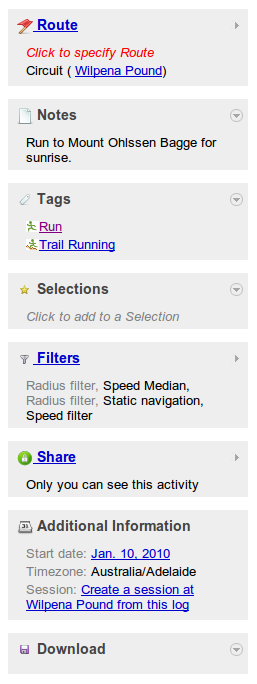
  • To replace the menu, a new information display and editing panel has been added to right hand side of the page:
    Screenshot-log-detail-panel-0
  • On this new panel, you can see all the details of the log and also directly edit notes about the activity, add the activity to Tags and Selections.
  • There is a summary of the Route, Filters and Sharing status and you can click the links to go to a page to edit them. These pages now also have a more consistent layout including "bread crumbs".

As always, I welcome feedback on these changes and would love to hear any suggestions you may have to make the site better.

Filed under  //  changelog  

Cleaning up a bad GPS log file

On a run the other day, my GPS logger (an AMOD AGL3080) recorded a really noisy signal and the resulting trace was inaccurate for the first 10 minutes. I have no idea why it did this, the second 10 minutes were fine.

The end result was a log which was almost unusable, the distance recorded was twice what it should be and the average speed was way off.

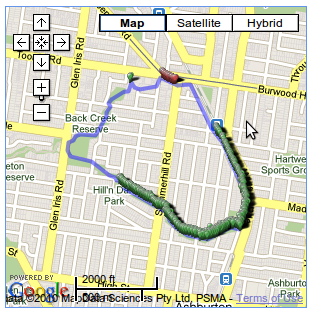
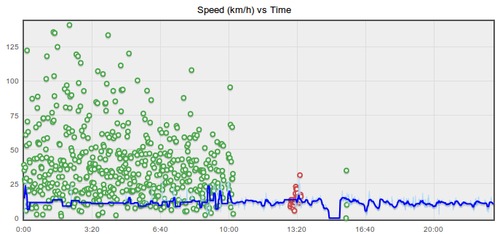
By experimenting with the Speed Filter I was able to find a set of filters that cleaned the log up remarkably, meaning I could include it in my training stats after all. The following graph and map show the discarded points and the resulting "cleaned" data:

Screenshot-filter-before-after

The red points are discarded by a Radius Filter as that section of the route goes down a lane-way where the signal is generally very bad.

The green points are discarded by the Speed Filter and show how bad the signal was for the first 10 minutes.

The speed is smoothed with a 10 second Speed Median filter too, but the discard filters do the bulk of the work.

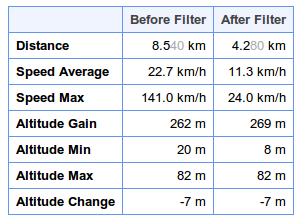
I had to experiment with the Speed Filter parameters by varying the cut-off speed until the log's distance was correct (based on previous logs along the same route). When the cut-off was too high, the resulting distance was still too long, and when it was too low, too many points were discarded and it was too short. Once the distance was right, the resulting average speeds were reasonable enough for me to be able to use them. As the table of before and after stats shows, the results were pretty dramatic:

0screenshot-filter-before-after

This is the most successful filtering of a log I've seen so far, generally it's removing much smaller amounts of noise, and it's great to know it can be this powerful. I hope some other GPSLog Labs users can get similar results too as it's very frustrating when a log of your activity doesn't record well and is unusable.
Filed under  //  discard filters   filters   position filter   speed filter   tips  

Updates for February 18th

There are lots of little changes going on to the layout of the GPSLog Labs site, some you might notice include:

  • The blog panel is now at the bottom of the home page, not on the side. This gives it some more space and hopefully it looks less like a panel of ads.
  • The Upload Log button is now present on every page.
  • I've added some "bread crumbs" to make it easier to get back to the Uploaded Log Files page and the Log File page from activity detail pages.
  • There are links from the Uploaded Log Files page directly through to the log activity, and the thumbnail maps now link to the activity page directly rather than popping up a preview map.
  • The Log File page has been rearranged with the maps and graphs on a separate tab if you really want to see them, but you're better off just going through to the activity detail page.

There'll be plenty more changes along these lines as I figure out ways to make the site easier to understand and use, if you've got any feedback or suggestions, please let me know.

Filed under  //  changelog  

Embedding maps and graphs in your site

In addition to sharing GPSLog Labs content via Twitter, Facebook, email and IM, another option is to embed maps and graphs of your activity in your own website.

To do this, you'll need to enable sharing for the content and then you'll be provided with a snippet of HTML you can cut and paste into your own website.

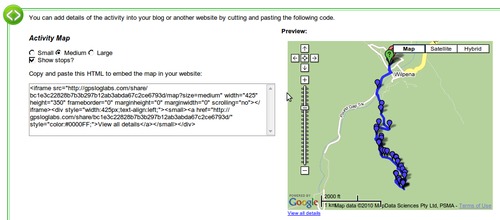
For example, to embed a map, you'll see the following on the Share Log page:

You can customize the size of your map and the whether you want stop icons to be drawn or not. You'll see a preview on the right and when you're happy with it you can cut the generated HTML code and paste it into your website. To embed a graph of your activity, follow the same steps.

Tip: It is possible to customize the size of the embedded map if the standard sizes are not appropriate by editing the HTML and adding &width=1234&height=1234 to the iframe src url, and also updating it's width and height attributes to match.

Note that if you Disable sharing for your activity, it will no longer be visible on your site, even if you re-enable sharing again as the secret URL will be different.

Filed under  //  changelog   embedding   graphs   maps   sharing  

Sharing your logs

By default all the activity you upload to GPSLog Labs is private and visible only to you.

If you want to share maps and graphs of your activity with your friends click the Share button to enable sharing:

Screenshot-sharing-1

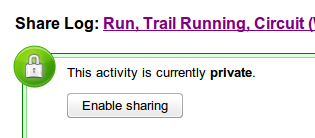
Then click the Enable sharing button:

Screenshot-sharing-2

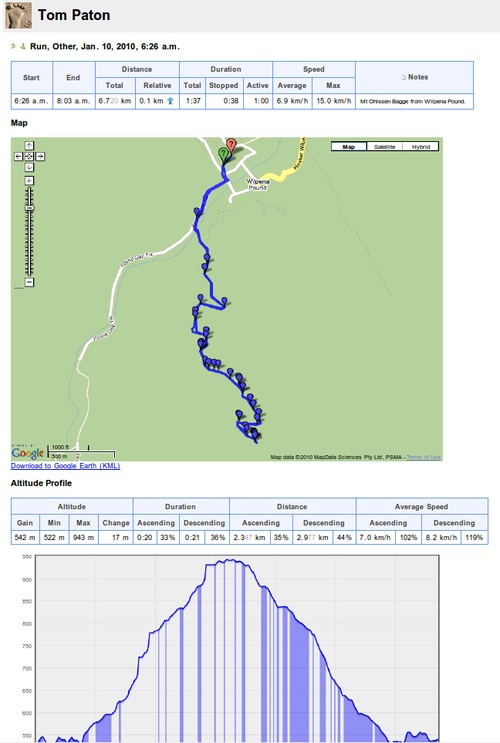
This will generate a publicly accessible detail page:

Which will look like this (actual link):

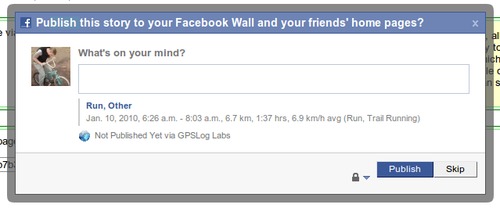
You can share the URL to this page on Twitter, Facebook, email, IM or wherever you like, for example, clicking the Share on Facebook link will open a window which will let you customize a message and publish a link to your activity on your Wall:

At any time, you can click the Disable sharing button to hide the activity if you change your mind.

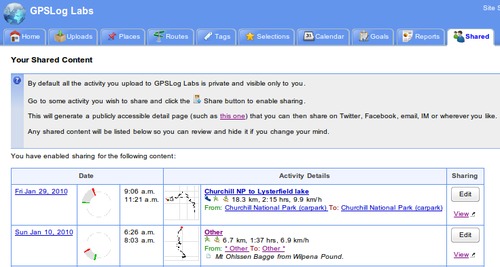
Any shared content will be indicated by a "sharing" icon

Shared

and will be listed on the Shared tab so you can review it.

I'll be adding the ability to share more kinds of content soon but if you have anything you'd like to see in particular, please let me know.

Filed under  //  changelog   facebook   graphs   maps   sharing   twitter  

Updates for February 8th

This post outlines a few of the recent updates to GPSLog Labs:

  • The automatic device format detection process has been cleaned up and improved so it works with multiple files:
  • The uploads page has a new layout:
  • And it's now easy to navigate through multiple files when editing uploads using the Next and Previous links:
    Screenshot-upload-next_prev
Filed under  //  changelog   devices   uploading  
← Newer posts Older posts →

© 2013 Tom Paton | GPSLogLabs.com | Source | Feedback | RSS | Subscribe