Embedding maps and graphs in your site
In addition to sharing GPSLog Labs content via Twitter, Facebook, email and IM, another option is to embed maps and graphs of your activity in your own website.
To do this, you'll need to enable sharing for the content and then you'll be provided with a snippet of HTML you can cut and paste into your own website.
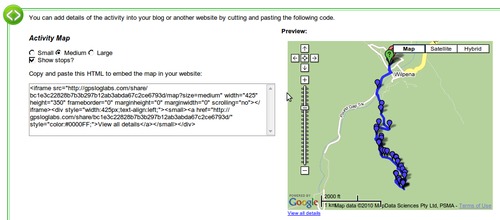
For example, to embed a map, you'll see the following on the Share Log page:
You can customize the size of your map and the whether you want stop icons to be drawn or not. You'll see a preview on the right and when you're happy with it you can cut the generated HTML code and paste it into your website. To embed a graph of your activity, follow the same steps.
Tip: It is possible to customize the size of the embedded map if the standard sizes are not appropriate by editing the HTML and adding &width=1234&height=1234 to the iframe src url, and also updating it's width and height attributes to match.
Note that if you Disable sharing for your activity, it will no longer be visible on your site, even if you re-enable sharing again as the secret URL will be different.
| ← Previous post | Next post → |
