GPSLog Labs Blog

GPSLog Labs Blog

New features and tips for using gpsloglabs.com

Filed under

sharing

Updates for August 25th

Yet another long gap between posts, but there have been lots of updates to GPSLog Labs in the interim. Here's a brief summary:

  • Keyboard shortcuts

    • f View fullscreen maps/graphs
    • q Open quickfind
    • escape Close full screen map/graphs and quickfind popup

    The keyboard shortcuts make all these features much more useful as they're only a keypress away.

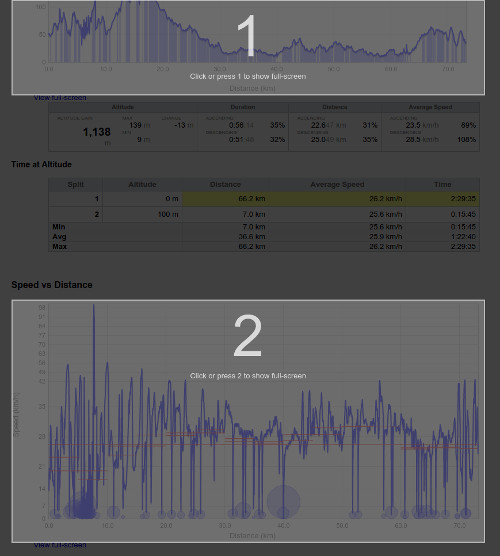
    A neat feature is if there is more than one possible graph/map to view in fullscreen, an overlay is added and you can press a number to select the one you're after.

  • Tag, place and route lifetimes

    A new visualisation attempts to indicate which tags, places and routes are still in use and those that are "retired".

    This information is also used to hide suggestions for tags and places you are probably no longer using and gray out the retired tags from the add tag popup and quick find popup.

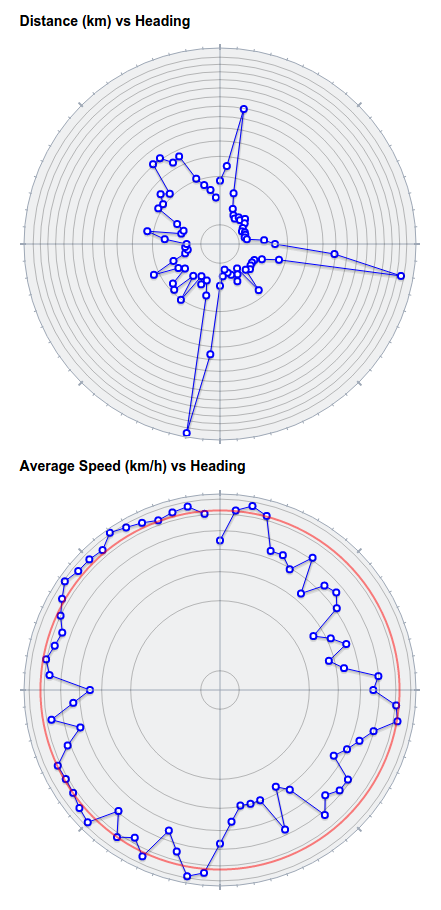
  • Distance and speed vs heading graphs

    These graphs have been made prettier and easier to read with the graph now rendered as a circle with ticks for the compass points.

  • I've added axis labels to all the graphs, which will make all the grade 6 maths teachers out there happy, as well as making the graphs much easier to understand.

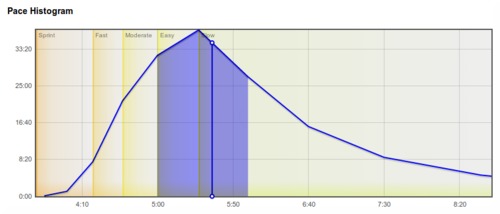
  • The goal, route and split detail trend graphs tabs have speed and heart rate histograms on them too now, which helps spot the trends better at a glance.

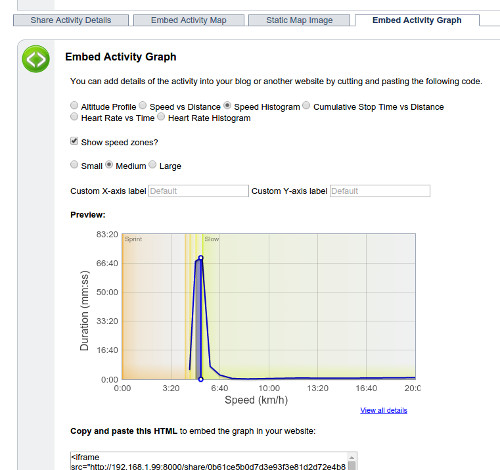
  • The embedded graphs you can share on your own sites now support speed and heart rate zones backgrounds as options, and also let you specify the text for the axis labels.

  • Laps graph

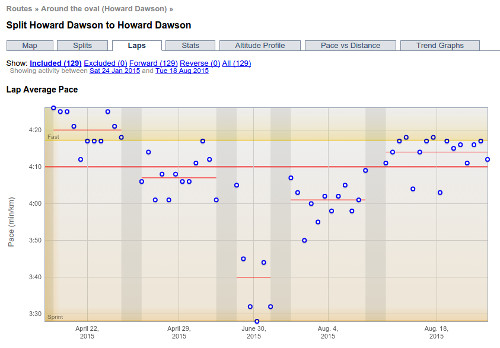
    There's a new Laps tab on route split detail page that compares performance across sessions on activities with multiple laps, e.g. hill intervals or laps around an oval.
Filed under  //  changelog   tags   keyboard   graphs   sharing   embedding   routes   checkpoints  

Updates for December 17th

Some recent updates to GPSLog Labs, just in time for Christmas:

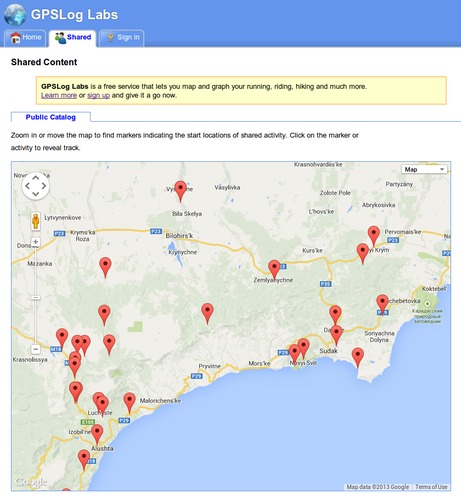
  • GPSLog Labs now has a public catalog of shared logs.

    By zooming in on a region of the world map, you can see activity other users have shared and use it to plan your runs, rides and hikes.

    You can still choose to keep your activity entirely private, or share it with a specific group of people, but if you want to include your activity in the catalog, simply go to your shared content, edit the activity you wish to share, and tick the "Include in Public Catalog" checkbox.

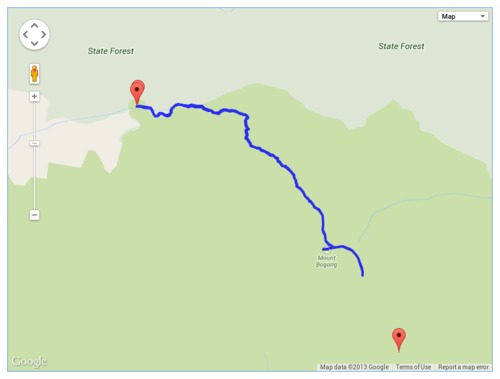
  • You can also now download shared activity as a GPX file which can then be loaded onto your device for navigation when you're out and about.

  • The route detail, route split detail and selection detail pages are now using a layout with a panel on the right hand side to better use the space on wider screens.

  • Editing notes in the side panels now saves your changes without reloading the page.
  • Also, I fixed a bunch of issues unfortunately introduced by the new dynamically loaded tabs. Apologies if you noticed things that weren't working properly for a while, and if you have any other issues, please let me know.
Filed under  //  changelog   routes   sharing  

Updates for September 7th

Some recent updates to GPSLog Labs:

  • New Alternative Routes page.

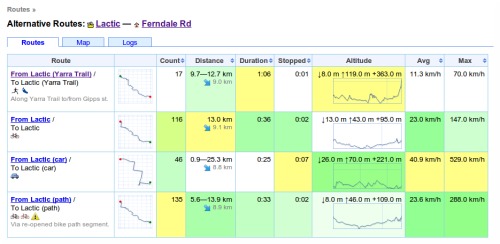
    This page lets you easily see all logs between two places, you can access it by clicking the "Alternative routes" menu option on one of the routes between the places you're interested in.

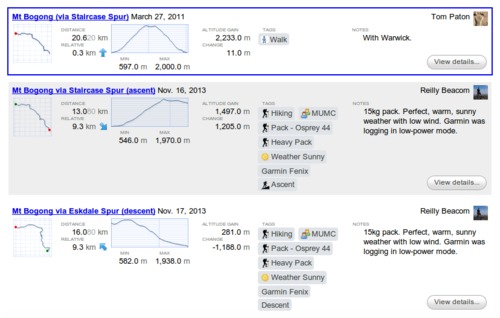
    It provides a summary of all routes between the two places:

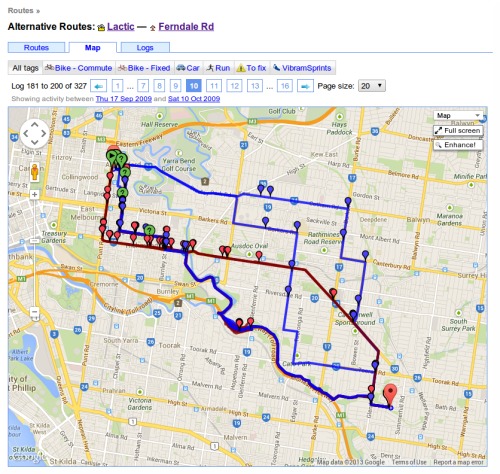
    And most usefully, it lets you see all activity in a comparison table or on a map, filtering to just one tag if you like:

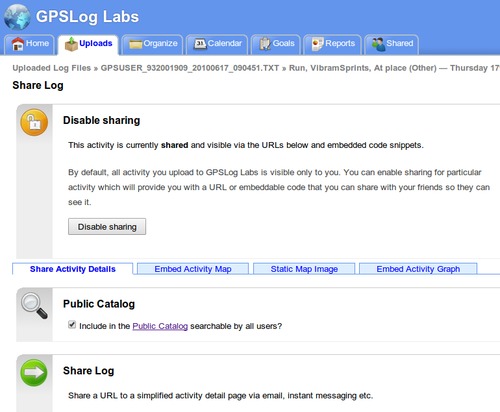
  • The Share Activity page was getting a bit long, so I've split it into tabs:

  • The session detail page has been updated with a better tag dialog and a layout that provides clearer indication of the activity that makes up the commute to and from the place and any activity at the place.

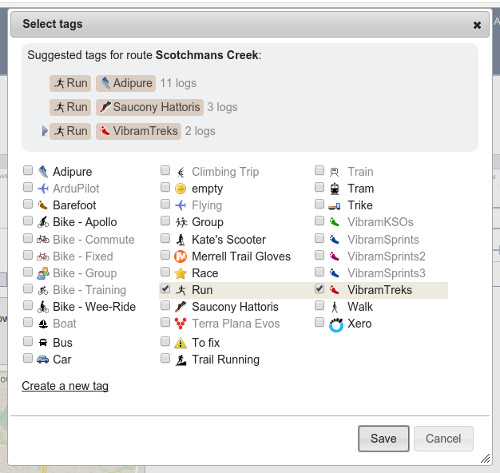
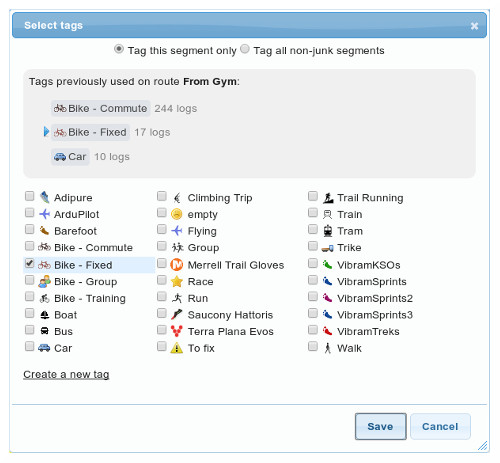
  • The Select tags dialog layout has been updated to show the list of tags in columns and selected tags are highlighted better now too, making it easier to use.

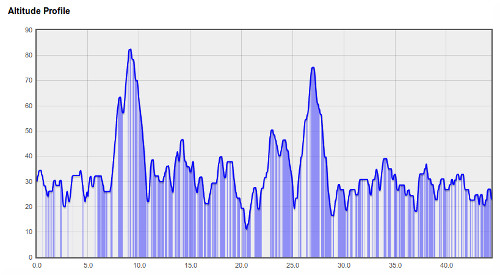
  • I've changed the altitude profile graphs (and thumbnails) so they no longer "zoom to fit". An example is the easiest way to show what I mean, this is what the altitude profile used to look like:

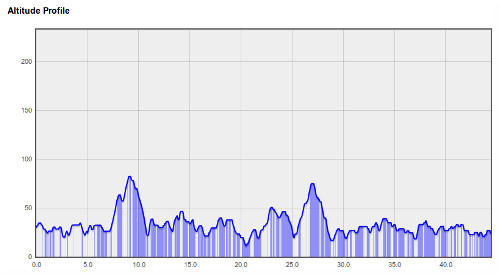
    Looks pretty steep and hilly, but the hills are only 50m high! The new graphs now limit the stretching so the profile is a bit more representative:

    The maximum exaggeration is limited to about 75 times, which seemed to offer a reasonable compromise that still shows the hills in some detail without ending up totally flat when the distances is very large.

  • Fixed a bug so tasks added to duration-based goals are correctly displayed in hours.

  • Fixed a bug so that activity details are displayed correctly if all points were removed by a filter.

Filed under  //  changelog   sharing   routes   sessions   tags   graphs  

Updates for August 25th

Some recent (and some not so recent) updates to GPSLog Labs:

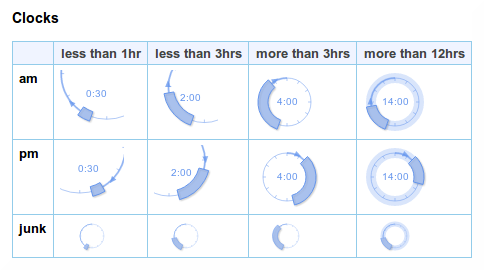
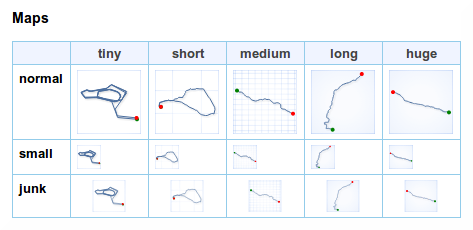
  • New clock, altitude profile and map thumbnails.

    The thumbnail images have a new updated look that is smoother and more detailed. They are also rendered in the browser, rather than being downloaded, which speeds up the display of the pages.

    The clocks now "zoom in" when indicating short durations to make the most of the available space and show the duration in hours and minutes too. A duration of greater than 12 hours is indicated by shading the full circle.

    An arrow indicates whether the time is a.m. or p.m. (the arrow points from the start or end time to noon).

    Times for "junk" activity are shown in a small and simplified thumbnail.
    Altitude thumbnails simply show the profile, with distance grid lines every 10km and altitude grid lines every 100m.
    Map thumbnails have a 1km grid to indicate scale, and show the start location as a green dot and the end location as a red dot.

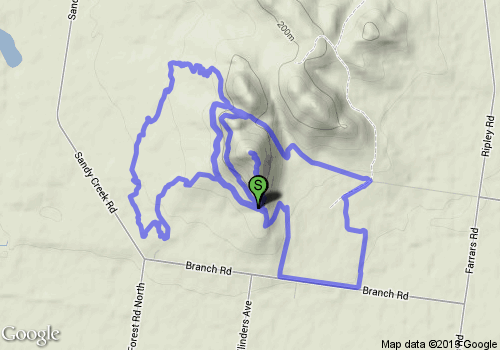
  • You can now generate a Google "static map image url" for an activity via the Activity detail "Share Log" page. I.e. a simple image file that can be downloaded or added to a page and it doesn't require any scripting to make it work.

    This feature is only available for shared activity, but once the url has been generated or the image downloaded, the activity can be made private again.

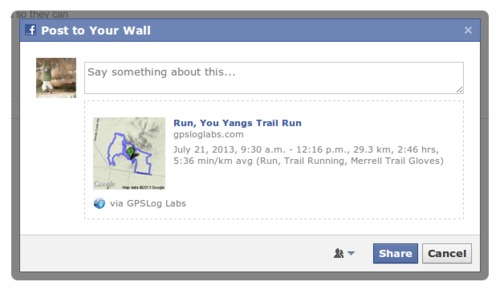
  • The thumbnail for activity you share to your Facebook timeline is now a small "terrain" map. This looks nicer and has more detail than the old icon.

  • Activity tags are now sorted by overall frequency, not just alphabetically. This makes the titles of pages (particularly shared activity and posts to Facebook etc.) more sensible as the primary activity tag is likely to be first (e.g. "Bike" or "Run") followed by any minor tags (e.g. shoe type or bike being used).

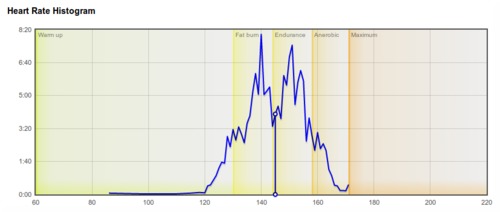
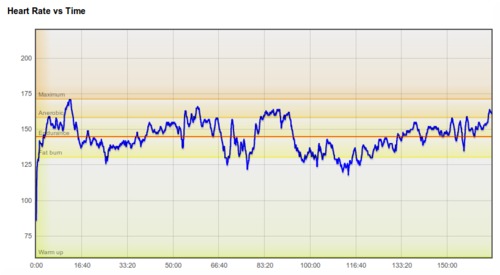
  • I've added shading on activity heart rate graphs to indicate hear rate zones:

    An earlier post has details on setting up heart rate zones for your tags.

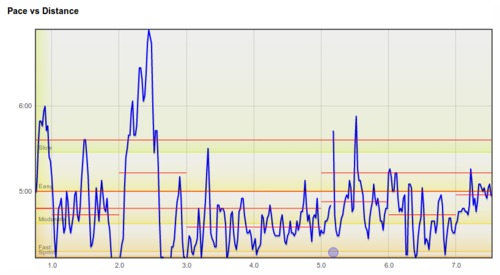
  • Likewise, there is also shading on activity speed graphs to indicate speed zones if you have them configured.

    There are links under these graphs to take you to the zone configuration if you haven't yet set up speed zones (or heart rate zones).

  • A bug that meant times weren't working properly for non-English dates on the manually create segments page has been fixed. Note, this page still won't work properly for very long files/segments. It's probably best that those are edited using gpsbabel before uploading to GPSLog Labs.

    This page has also been updated with the new layout.

Filed under  //  changelog   graphs   maps   filters   editing   facebook   sharing   thumbnails   time filter   tags   heartrate  

Updates for May 29th

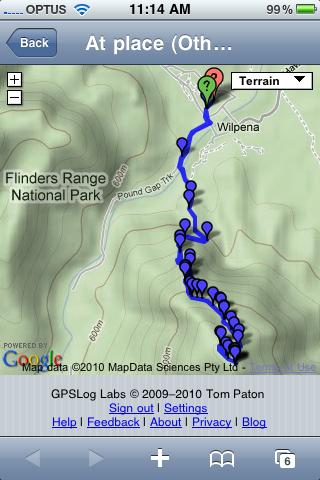
  • The shared log detail page now has a mobile (iPhone) optimized version:
    Img_0730
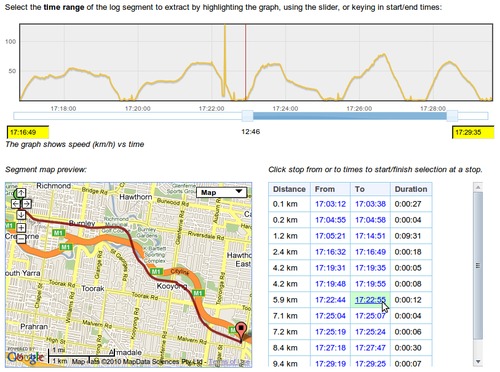
  • A list of stops is displayed when manually creating log segments. You can click on the stop times to start stop the segment at that point. The interface is a little rough, any suggestions on how to make it easier to use are welcome.
  • Merging log segments is a little smarter, and it is now easy to remove a little "junk" other segment from the start or end of a log.
  • You can now add an icon to distinguish your devices:
Filed under  //  changelog   devices   iphone   merge   mobile version   sharing  

Embedding maps and graphs in your site

In addition to sharing GPSLog Labs content via Twitter, Facebook, email and IM, another option is to embed maps and graphs of your activity in your own website.

To do this, you'll need to enable sharing for the content and then you'll be provided with a snippet of HTML you can cut and paste into your own website.

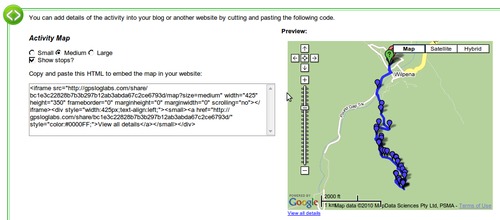
For example, to embed a map, you'll see the following on the Share Log page:

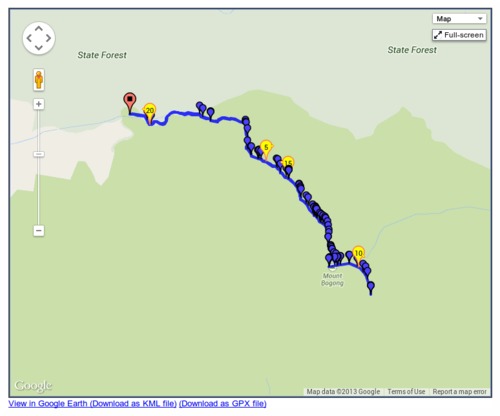
You can customize the size of your map and the whether you want stop icons to be drawn or not. You'll see a preview on the right and when you're happy with it you can cut the generated HTML code and paste it into your website. To embed a graph of your activity, follow the same steps.

Tip: It is possible to customize the size of the embedded map if the standard sizes are not appropriate by editing the HTML and adding &width=1234&height=1234 to the iframe src url, and also updating it's width and height attributes to match.

Note that if you Disable sharing for your activity, it will no longer be visible on your site, even if you re-enable sharing again as the secret URL will be different.

Filed under  //  changelog   embedding   graphs   maps   sharing  

Sharing your logs

By default all the activity you upload to GPSLog Labs is private and visible only to you.

If you want to share maps and graphs of your activity with your friends click the Share button to enable sharing:

Screenshot-sharing-1

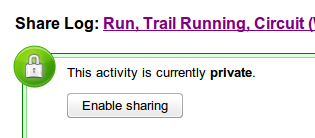
Then click the Enable sharing button:

Screenshot-sharing-2

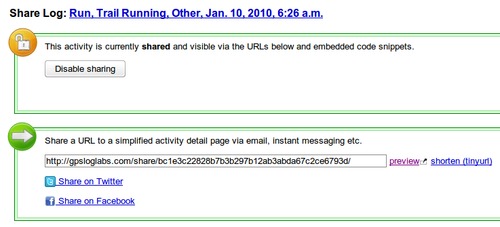
This will generate a publicly accessible detail page:

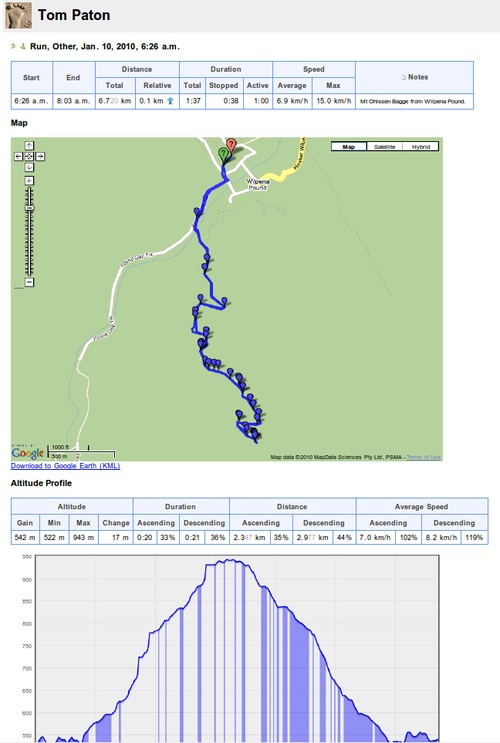
Which will look like this (actual link):

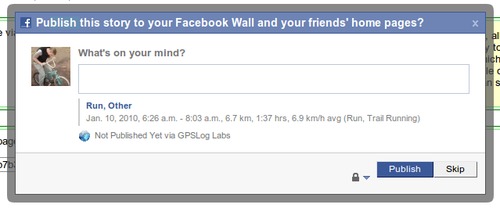
You can share the URL to this page on Twitter, Facebook, email, IM or wherever you like, for example, clicking the Share on Facebook link will open a window which will let you customize a message and publish a link to your activity on your Wall:

At any time, you can click the Disable sharing button to hide the activity if you change your mind.

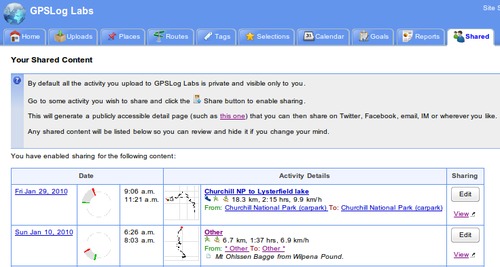
Any shared content will be indicated by a "sharing" icon

Shared

and will be listed on the Shared tab so you can review it.

I'll be adding the ability to share more kinds of content soon but if you have anything you'd like to see in particular, please let me know.

Filed under  //  changelog   facebook   graphs   maps   sharing   twitter  

Updates for February 5th

There have been lots of little updates to GPSLog Labs since my last post and a couple of big new features that I'll preview here but will explain in full detail in future posts.

  • Translations: GPSLog Labs is now available in different languages.

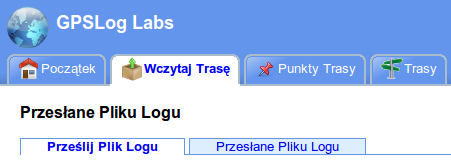
    By default only day and month names will be translated, but there is a more comprehensive Polish translation thanks to Lukasz. If you want to help out translating GPSLog Labs into your language, contact me at tom@gpsloglabs.com.

    Screenshot-polish
  • Upload via email: On the detail page for your device you will be provided with an email address that you can email logs to (as attachments) and they will be processed. When they're ready you'll receive a reply with the links to your activity. This is particularly useful if you want to upload a track recorded on your iPhone using MotionX GPS app, for example.
  • Sharing: By default all your activity on GPSLog Labs is private and visible only to you, but Logs now have a Share button that lets you generate a publicly accessible detail page, such as this one.

    You can then share the URL on Twitter, Facebook, email, IM or wherever you like.

    You can also get a snippet of HTML to embed the map or graphs into your own website like this:

Filed under  //  changelog   email   goals   iphone   sharing   translation   uploading  

© 2013 Tom Paton | GPSLogLabs.com | Source | Feedback | RSS | Subscribe