Updates for August 25th
Some recent (and some not so recent) updates to GPSLog Labs:
-
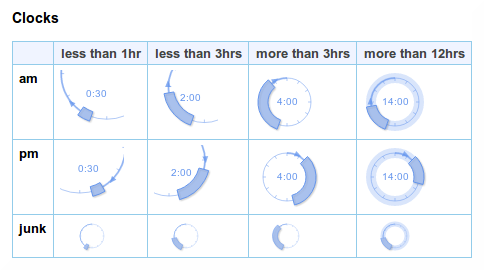
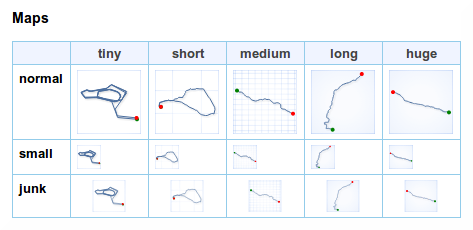
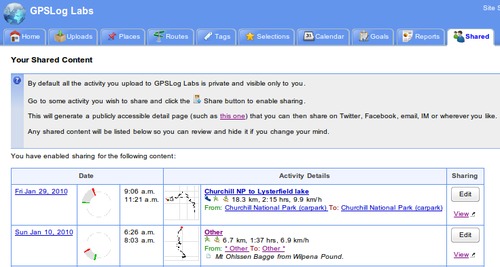
New clock, altitude profile and map thumbnails.
The thumbnail images have a new updated look that is smoother and more detailed. They are also rendered in the browser, rather than being downloaded, which speeds up the display of the pages.
The clocks now "zoom in" when indicating short durations to make the most of the available space and show the duration in hours and minutes too. A duration of greater than 12 hours is indicated by shading the full circle.
An arrow indicates whether the time is a.m. or p.m. (the arrow points from the start or end time to noon).
Times for "junk" activity are shown in a small and simplified thumbnail.
Altitude thumbnails simply show the profile, with distance grid lines every 10km and altitude grid lines every 100m.
Map thumbnails have a 1km grid to indicate scale, and show the start location as a green dot and the end location as a red dot.
-
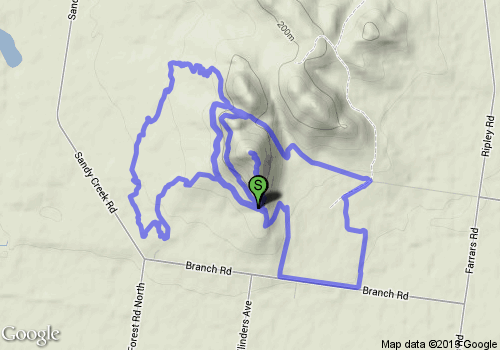
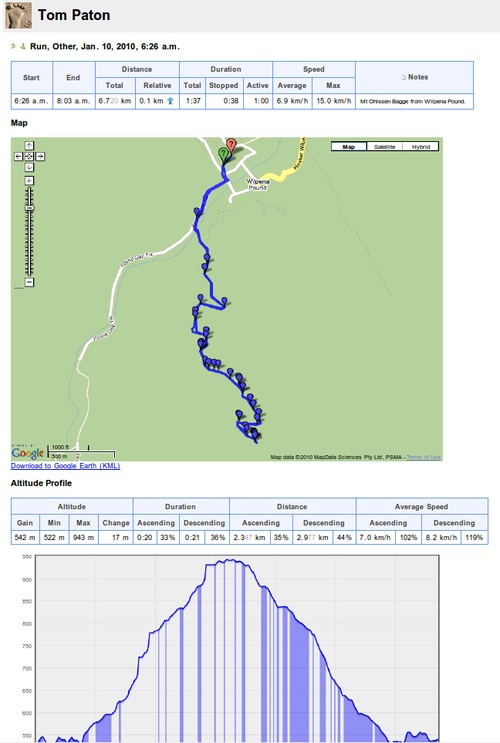
You can now generate a Google "static map image url" for an activity via the Activity detail "Share Log" page. I.e. a simple image file that can be downloaded or added to a page and it doesn't require any scripting to make it work.
This feature is only available for shared activity, but once the url has been generated or the image downloaded, the activity can be made private again.
-
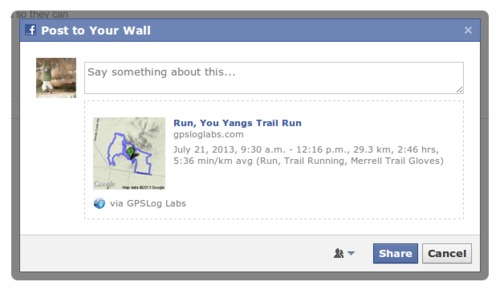
The thumbnail for activity you share to your Facebook timeline is now a small "terrain" map. This looks nicer and has more detail than the old icon.
-
Activity tags are now sorted by overall frequency, not just alphabetically. This makes the titles of pages (particularly shared activity and posts to Facebook etc.) more sensible as the primary activity tag is likely to be first (e.g. "Bike" or "Run") followed by any minor tags (e.g. shoe type or bike being used).
-
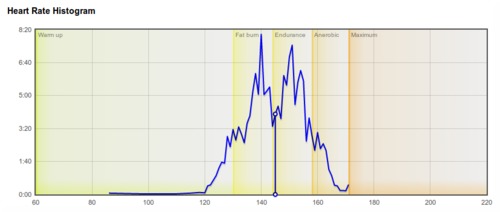
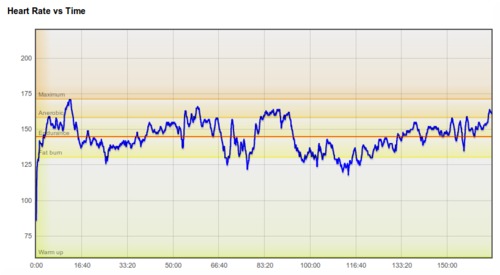
I've added shading on activity heart rate graphs to indicate hear rate zones:
An earlier post has details on setting up heart rate zones for your tags.
-
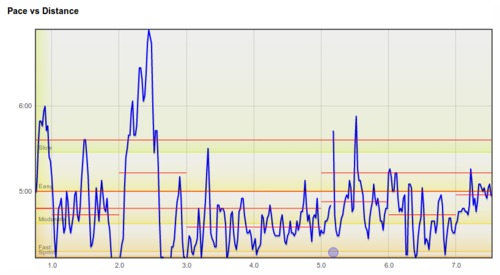
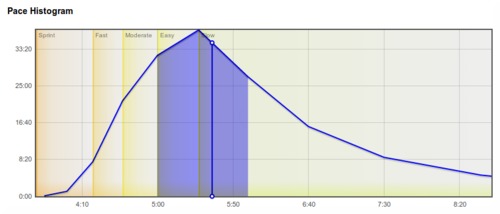
Likewise, there is also shading on activity speed graphs to indicate speed zones if you have them configured.
There are links under these graphs to take you to the zone configuration if you haven't yet set up speed zones (or heart rate zones).
-
A bug that meant times weren't working properly for non-English dates on the manually create segments page has been fixed. Note, this page still won't work properly for very long files/segments. It's probably best that those are edited using gpsbabel before uploading to GPSLog Labs.
This page has also been updated with the new layout.
