GPSLog Labs Blog

GPSLog Labs Blog

New features and tips for using gpsloglabs.com

Filed under

changelog

Updates for July 14th

Some big changes have been made to how your uploaded log files are processed. Hopefully this should handle big files a bit better than before, but other than that there shouldn't be any noticeable differences. No doubt some little bugs will have crept in however, so if you notice anything weird, please let me know.

There have been a few other minor changes too:

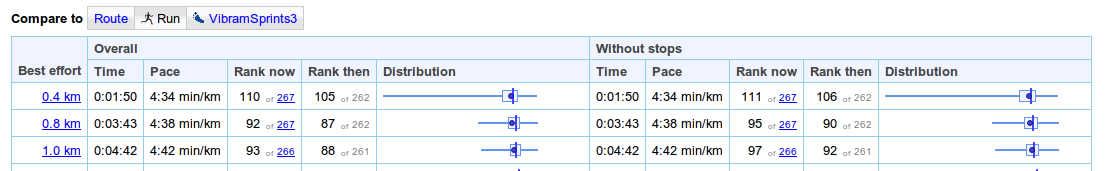
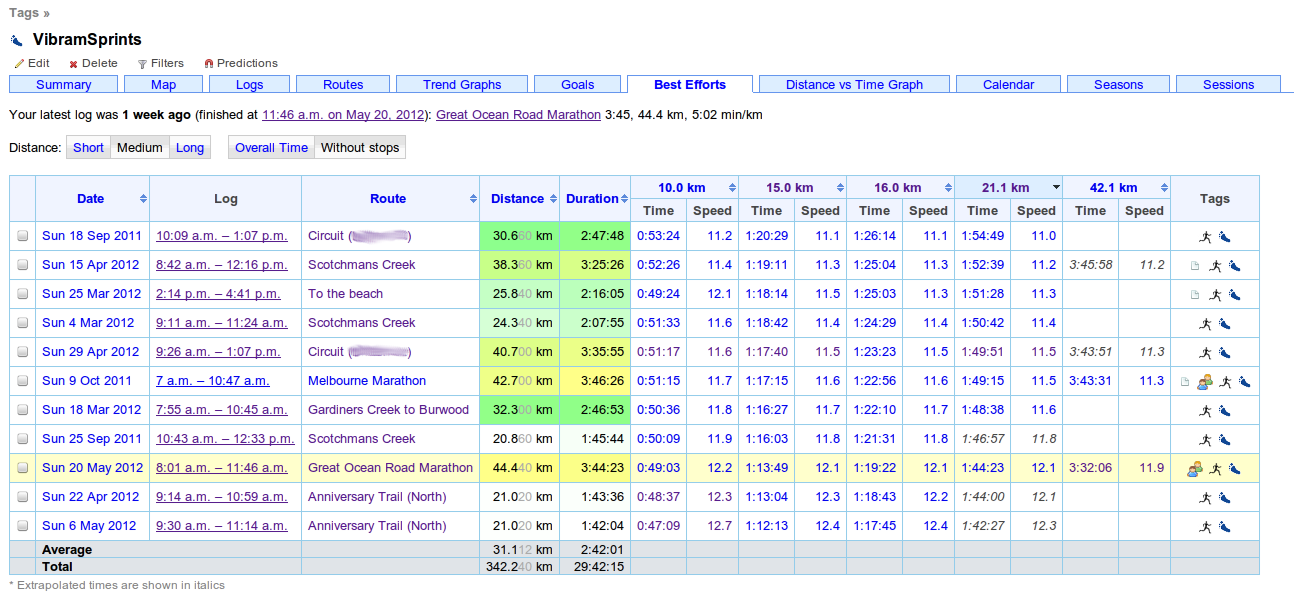
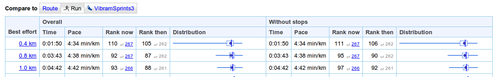
  • The best effort tables now have two rankings displayed. One is the rank at the time of the activity ("rank then"), and the other is the rank of the activity for all time ("rank now").

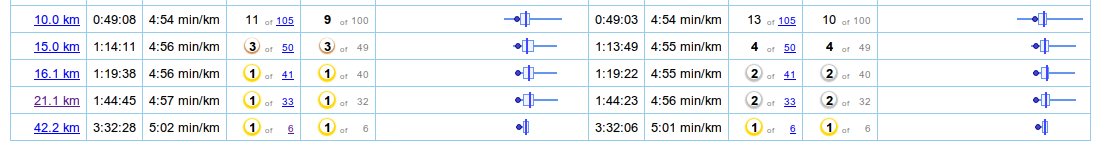
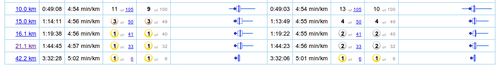
  • And the 1st through 9th places in rankings get a pretty highlight:

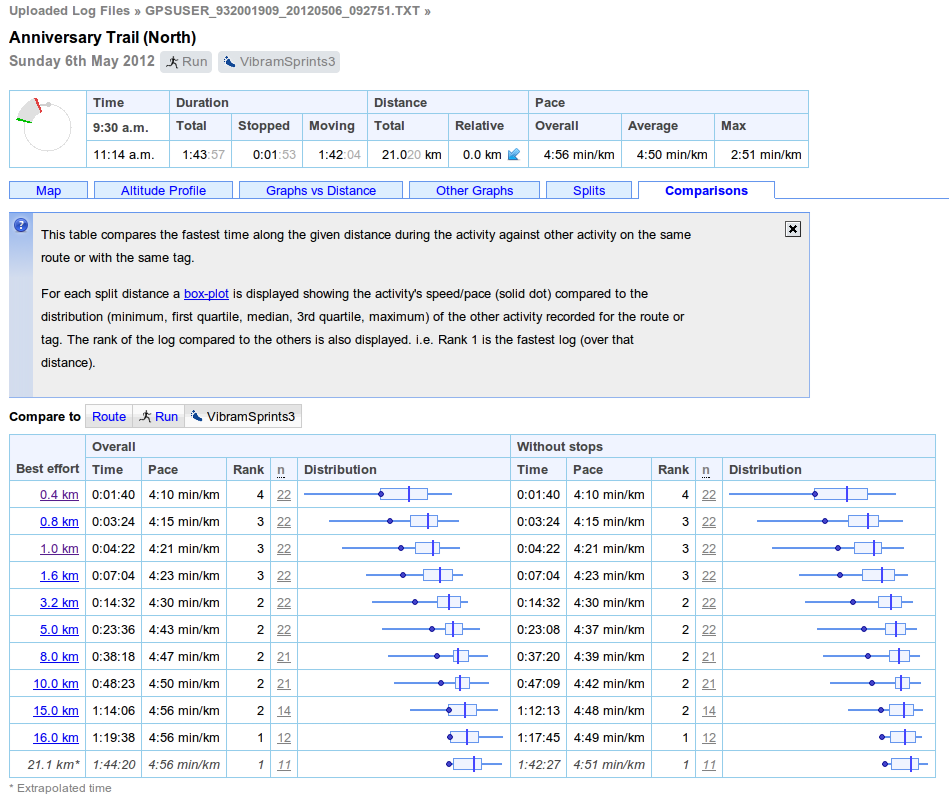
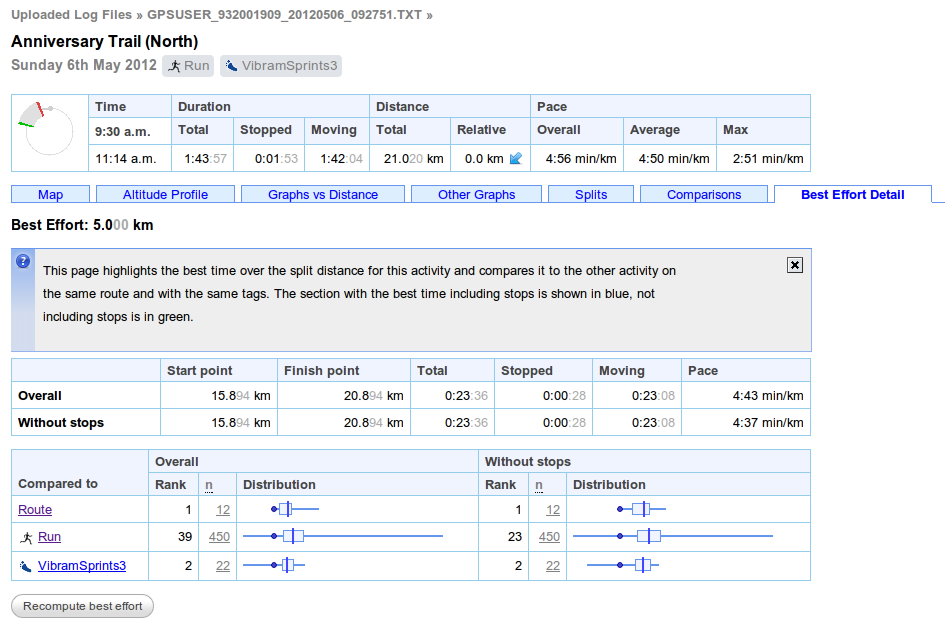
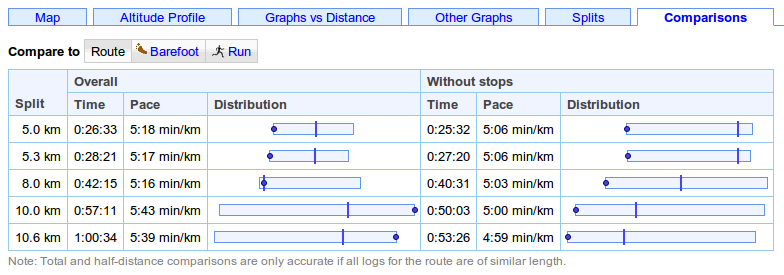
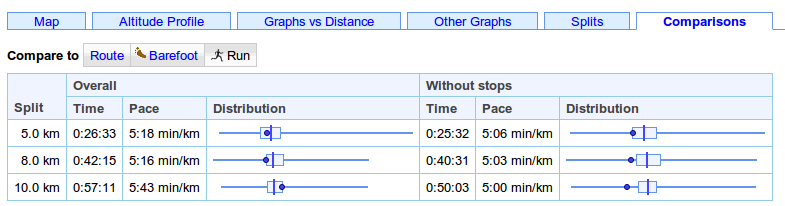
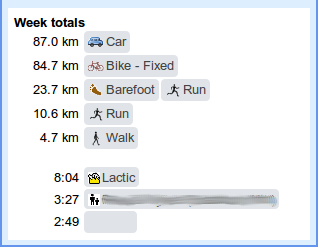
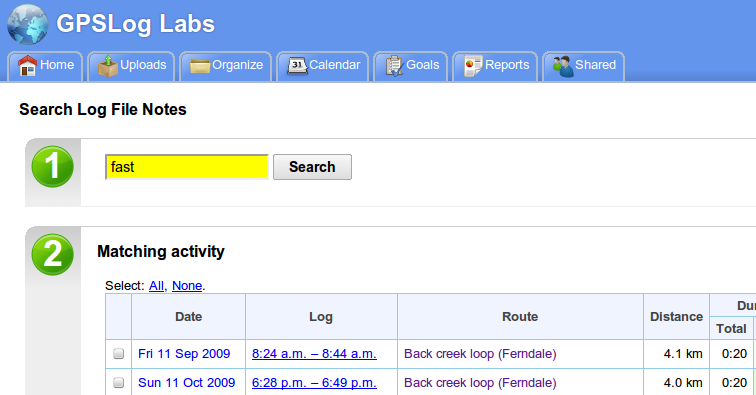
  • A table of best effort times/speeds has also been added to the shared activity page.
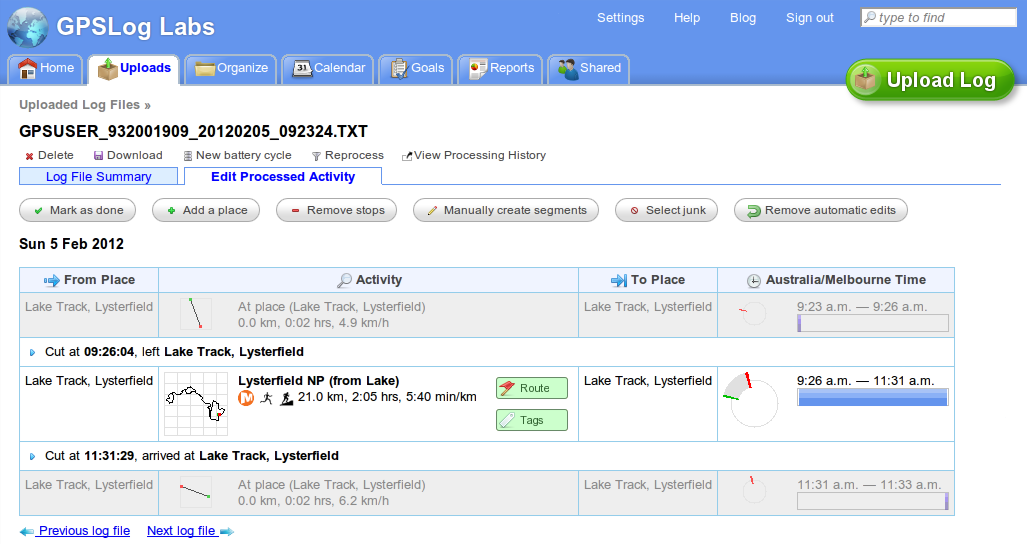
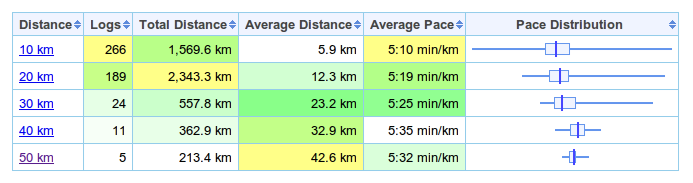
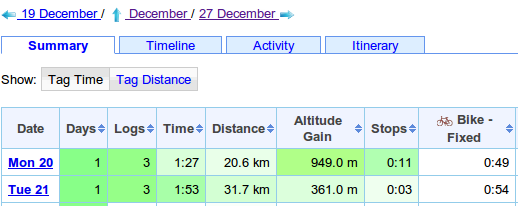
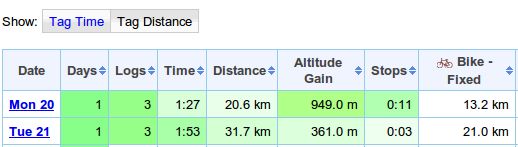
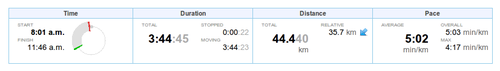
  • The activity detail page's summary table now has a nicer layout too:

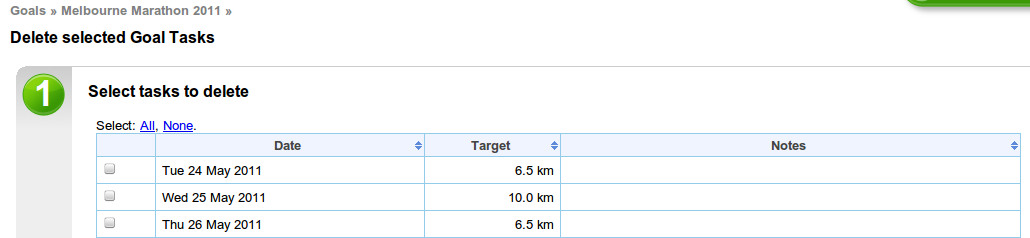
  • Lastly, there was a bug dragging and dropping tasks on the goal calendar which is now fixed and working properly again.
Filed under  //  bestefforts   changelog   processing  

Updates for May 27th

  • GPSLog Labs now calculates "Best efforts" for your uploaded activity. This is a powerful new analysis that finds the fastest sections of an activity over standard distances and allows them to be compared easily. For example, it may find that the fastest 10km of a run was the last portion, and allow that to be compared against all other times you've run that distance or further. The times for each distance are shown on the Comparisons tab of the Activity detail page using box plots to compare them to other activity on the same route or with the same tags.

    Activity times are extrapolated if they are close to a standard distance (within about 10%).

    Best efforts replace the old "standard splits" which were locked to the start of the activity, which were similar but limited in usefulness.

  • Clicking on the best effort distance will show the Best Effort Detail tab:

    This shows the detailed statistics for the best effort and compares it to similar efforts on other activity for the route and tags.

    There's also a map showing the segment of the log where the best effort was recorded, the fastest sections with and without stops are coloured blue and green, the whole track being shown in grey.

    The best effort is highlighted on the speed graphs too, in the example below, the best efforts with and without stops coincide:

  • The computed best efforts can unfortunately often be incorrect due to bad GPS data, and while it's possible to clean up the activity using the Filters, it is also possible to solve this problem by giving the system an indication of a more reasonable maximum speed for the best effort.

    Click the"Recompute best effort" button on the detail page for the incorrect best effort:

    This will recompute the best effort for this activity, but will ignore any potential best efforts that are above the speed indicated as reasonable. By lowering the speed you should be able to find a best effort that ignores sections which are "corrupted" due to bad GPS data.
  • Best efforts are summarised for tags and routes, allowing you to find your fastest times over given distances:
  • Best efforts can be visualised for a route too, to give an indication of where the sections you go fastest are: The altitude profile of the route is superimposed over a chart indicating the locations of the recorded best efforts at each distance for activity on the route.
  • The Activity Filters editing page has been improved for filters that discard a lot of points so they are now displayed without slowing down the page unnecessarily.
  • Waypoints have been added to time/manual discard filter in addition to the position filter. This makes it possible to quickly and easily select a section of an activity where the GPS signal is bad and replace it with a more accurate representation of the track.
  • The little clock thumbnails now have an indication of a.m. and p.m. to help identify activity at a glance:
    Timethumbnail-am
    Times are indicated as "a.m." with a thicker line going from the end time to noon.
    Timethumbnail-pm
    Times are indicated as "p.m." with the thicker line going from noon to the start time.
  • On the Organise Places page, there is a Network tab that shows a neat visualisation of your activity between the places you have created:
Filed under  //  bestefforts   changelog  

Updates for March 25th

There have been plenty of little updates to GPSLog Labs over the past few months, I've just been slack documenting them. There are also two bigger updates I'll put in separate posts (soon I hope!)

  • You can now download your logs in GPX format (can't believe that wasn't in there already), which means you can take advantage of GPSLog Lab's advanced editing and filtering capabilities and then export the cleaned up data for use in other sites or loading maps back onto your device.
  • The edit processed activity page has been rearranged, with the"activity" column moved to left of the table to make editing actions more obvious.

    Also, the mark as done button is now more useful since predictions are doing tagging/route assignment automatically, so has been moved to the top of the page.

  • The side panel of activity detail page has been cleaned up and made easier to understand, hopefully it's clearer now how to get to the route page and how to select different routes.
    Activity-detail-panel-1
  • The activity detail page now uses the same route/tag selection popups as the edit log file activity page, as does the manual entry detail page. These include better filtering and suggestions than the old versions.
  • Added estimated distribution curves to place session durations, place and tag days between logs graphs. These are really just a guess to make it look pretty, and assume that it's a Gaussian or Poisson distribution which is doubtful!
  • Added first/last activity dates to tag summary table
  • Added speed/pace distribution box whisker plots to tag summary, route detail splits tab, and activity detail splits table.
  • Added box whisker of current battery cycle vs history to home page device list, this will give you a much clearer idea of how much time is remaining than a simple average.
    Home-device-boxwhisker-1
  • The checkpoint edit page now has a link to load data from logs using the route so the checkpoint can be placed accurately.
  • I've made some changes to the upload processing that will hopefully make it better at handling large input files. As always though, the memory available on the server is limited, so the site will always struggle if you're uploading files with many days worth of data in them. For best results, I suggest using GPSBabel to chop your file into smaller pieces before uploading it.
Filed under  //  changelog  

Updates for December 29th

A few little enhancements to GPSLog Labs that have been made lately:

  • Many graphs now have a "View full-screen" link like the maps. This will let you really zoom into the details!
  • A few pages on the site now take advantage of wider screens if you have one.
  • Standard splits displayed on the log detail Comparisons tab now show extrapolated times if they're a little short (within 10% of the split distance). This is handy if you've got a route that's pretty close to a standard distance and you'd like to see how it compares to other routes.
    The rank of the activity is displayed in the comparison table too, and the standard split times are now also displayed on the distance finish time predictions graph.
  • Uploaded log files can now be deleted in bulk from the device log files page. This is handy if you're logging via an iPhone app and extra files are included in the zip files you email.
  • The trend graphs (for Tags, Goals, Routes) have a line of best fit added, as well as displaying the overall average.
  • The Distance vs Time graphs on the Tag and Goal detail pages have a new Group by tags option in addition to the group by route and age options.
  • The map showing all GPSLog Labs users' places now clusters icons together and shows how many places have been added in each region.
  • The remaining battery life for your device warning on the home page now gives a range in it's estimation of how much time is left.
Filed under  //  changelog   graphs  

Updates for September 2nd

Updates to GPSLog Labs have been trickling in slowly over the last few months, so it's about time I mentioned a few of them on the blog:

  • Maps now have a "View full-screen" link at the bottom left:
    Screenshot-full-screen-1
    This will expand the map so it fills the browser window:
  • Buddy icons (displayed on your shared log detail pages) will now use the Gravatar for the email address you've set in your Account Settings. You can still upload an icon if you'd prefer not to use Gravatars.
    000000000000000000000000000000
  • Fancy, searchable dropdown lists (courtesy of the Chosen library):
    Screenshot-chosen-multiple
    Screenshot-chosen-single
  • "Remove automatic edits" command: Auto-chopping logs is one of GPSLog Labs' most powerful features, but sometimes you just want the entire log file. This command lets you remove all the cuts & places quickly and easily, so now you can have the best of both worlds.
  • Deleting tasks from a goal can now be done in bulk. This makes it much easier to customise a training program or edit tasks you've cloned from another goal.
  • The Distance Finish Time Predictions graph now shows the values at the mouse position.
  • The Cumulative Stop Time vs Distance graph shows the total stopped time when zooming to a selection.
  • Added sorting to the Goal task possible route selection table and fixed a few bugs with highlighting routes with appropriate distances.
Filed under  //  changelog   maps  

Updates for March 11th

A few little changes to note while I'm busy working on something big and pretty cool:

  • The minimum split time between checkpoints on a route has been changed from 5 minutes to 1 minute, so you can now record splits as short as laps around an oval, assuming you're not too fast that is.
  • Distances and times are now displayed with full precision in the splits detail table.
  • The mobile page now has a "Recent Uploads" list, so you can check them quickly when uploading from a phone.
  • Route "average" distances are now only shown if the logs are similar in length, otherwise the range of distances is displayed.
  • I've added columns showing the last logged date and scheduled count for routes when selecting them for goal tasks.
  • The next scheduled task for a goal is displayed in the goals table and on the summary page for quick reference.
  • The goal tasks graph now has a link to zoom it in to a view of this week.
Filed under  //  changelog   goals   splits   tasks  

Updates for February 21st

I've just added a really useful feature to GPSLog Labs: The "Comparisons" tab for an activity page now actually shows some useful comparisons in a "dashboard" format.

For each of the "standard split" distances (5 km, 5 miles, 10 km, etc.) the speed/pace and time for this log are displayed and compared to that for the other activity on the same route and/or sharing the same tags using a box plot.

The above screenshot shows the speeds for that particular run using solid dots on the box plot, and indicates it was the fastest for that route when stops are removed, but that there was a long stop somewhere between the 8 and 10 km splits that made it the slowest over those distances (the smallest value is on the left of the graphs, so rightmost is best for speed and leftmost is best for pace.)

Comparing it to all the activity tagged with Run, not just along that particular route shows it was in the top 25% (after taking out the stop):

The route comparison shows two extra splits that are not available when comparing to the tag, the total distance (10.6 km in this case) and the half-way point (5.3 km). These assume that all activity on the route is about the same length, so aren't meaningful for a tag and may also not be very useful if you have a route which varies a lot in length.

Some other recent updates to the site:

  • Pages with many tabs will have some of the tabs hidden to save space. Click the "more >>" button to show the rest.
  • The unknown routes page now lets you filter by tag.
  • When setting up a task for a goal, you can now filter the possible routes by place. This means that you can quickly find a route of the desired distance to complete the task and aren't overwhelmed by routes from places you don't need.
  • There are a couple of QR Codes on the site now to help get the urls into your mobile device. Scan the following QR code to go to the mobile version of GPSLog Labs, for example.
    Qrcode
    There is also a QR code for the unique upload email address for your device on it's detail page.
  • When adding tasks from a training program to a goal, or creating a new goal from a training program, you can now see a preview graph of the tasks involved:
  • The tag detail page has a new Splits Graph tab that shows a graph of all the activity speeds/times at standard split distances, together with lines indicating the distribution (10th, 50th, 90th percentiles).
  • The standard split distances now extend from 50km to 300km (50mi to 200mi) to make them more useful to cyclists and longer distance activities.

As always, please send feedback and suggestions to feedback forum.

Filed under  //  changelog   comparisons   goals   graphs   qr codes   splits   tasks   training program  

Updates for February 8th

Some of these have been live on the GPSLog Labs for a while now, I just haven't had a chance to blog about them.

  • A preview map and details are now available on the week calendar activity page, to make it work the same way as the home page.
  • The activity table now shows weekly totals by tag and place.
    Screenshot-week-totals
  • Activity paths are grayed out rather than removed from the preview map, meaning you can compare multiple paths on the map simultaneously.
    Screenshot-preview-map-paths
  • The calendar summary tables now have an option to toggle between displaying distance or duration totals for each tag.
  • The device detail page now has a button that will send you an email containing the upload email address making it easy to add it to your address book.
  • The tag popup form has a new option to apply the selected tags to all the non-junk segments of file. This only applies if the log file has been split into two or more segments.
  • The goal detail summary tab now has indicators of the daily activity for the week and month. There's one bar per day, green are the latest on the right, orange the oldest on the left. Hover over them for some details.
  • You can now search for activity by keywords entered into the notes. This is a little obscure still, type your query into the search box on the top right of any page and a button will appear to "Search activity notes for 'keyword'". Click it an you'll see a list of all matching activity.
  • The "Activity log as CSV" download now contains heart rate data if it was uploaded in a separate file, making it possible to do your own spreadsheet for analysis if you want.
  • The splits detail table now has a tags column and activity that has been excluded from the stats are indicated in the table, map, graphs.
  • The split detail pages now also have filtering of splits by forward/reverse direction and by included/excluded status.
  • The maximum supported upload size has been increased to 20mb.

Thanks for all the great feedback and suggestions on the GPSLog Labs Feedback page, please keep it coming.

Minor update to the update: I've added the activity search form to the bottom of the organise tab too. Makes sense to try and have it somewhere less hidden as well!

Filed under  //  changelog  

Updates for December 22nd

  • The "This week's activity" table on the home page of GPSLog Labs now allows you to scroll back and forward through your uploaded activity using "« Previous|This week|Next »" links. The old "Earlier activity" link has been removed as it's no longer needed.
  • The Trends report has been optimized and now runs much faster.
  • When editing an automatically created place, a list of suggested "Nearby places" is displayed to make it easier to correct logs where your logger didn't lock on at a place:
  • When editing an unmatched place, nearby places are now shown as markers on the map too. Clicking them will select the place from the drop-down list.
  • The activity detail page heading has been reformatted to make it easier to read:
    Screenshot-activity-detail-hea
  • The libraries of icons you can select from for your tags and places have been expanded and refined. They should be better looking and more useful now. Edit your tags or places to change them to one of the new icons:

    Tag icons:

    All_tags

    Place icons:

    All_places

    You can still upload your own icons if you want to, for best results they should be 16x16 pixels, in GIF or PNG format with transparent backgrounds.

  • You can now add goals based on the built in training programs. Click the Add Goal from Training Program link on the Goals page, select the program, put in your goal finish date (race/event day), select the tag you'll use to track your training logs and you're ready to go.
  • Two new training programs have been added too:
  • Adding tasks to goals has been made faster and easier too, and a bug was fixed that was preventing adding fractions of kilometers as the target distances (i.e. you could only enter whole numbers, not 6.5km for example.)

As always, feedback and suggestions are welcome and I hope everyone has a happy and safe Christmas and New Year.

Filed under  //  changelog   goals   icons   places   programs   suggested places   tags   tasks  

New "Splat" filter

A problem you'll encounter very quickly when using a GPS logger is "splats" in your log files caused by a bad signal while you're inside a building or other area with lots of signal reflections.

This can be very annoying as it will often create spikes in your speed that completely mess up any maximum speed or distance statistics for that log file.

For a while, GPSLog Labs has had "position" and "time" filters that let you manually remove these "splats" but it was tedious to get right, so now a simpler "splat filter" has been added that makes the process much less painful.

First, go to the activity you want to filter and click on the Filters link in the side panel:

Screenshot-splat-filter-before

Then click "Add a filter" and choose "Splat filter":

On the Splat filter page, you need to drag the marker so that it covers the "door" of the building. It doesn't have to cover all of the spikes of the splat, you just need to capture the last good point before you enter the building and the first good point when you get out and start getting a good signal again.

As you can see, the marker is only covering the actual building under the splat, not the whole splat.

The Splat filter will then discard all the points while you were inside the building and interpolate over the gap (which will give you a long period of very slow or 0 speed, restoring the stats of your log back to something sane):

The results are dramatically better, the distance and maximum speed are both now much more accurate and representative. This log also included the Static Navigation filter as the AMOD AGL 3080 logger was quite bad for logging at walking speeds.

Enjoy!

Filed under  //  changelog   discard filters   filters   position filter   splat filter   time filter  
← Newer posts Older posts →

© 2013 Tom Paton | GPSLogLabs.com | Source | Feedback | RSS | Subscribe