Updates for February 21st
I've just added a really useful feature to GPSLog Labs: The "Comparisons" tab for an activity page now actually shows some useful comparisons in a "dashboard" format.
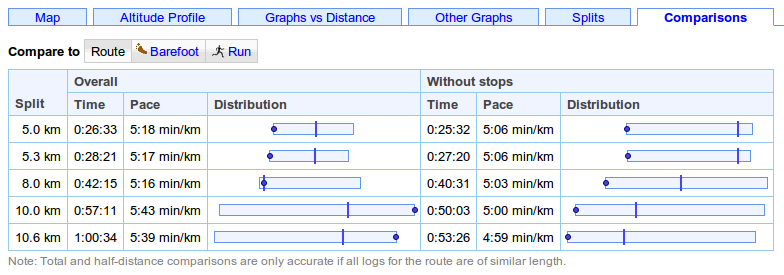
For each of the "standard split" distances (5 km, 5 miles, 10 km, etc.) the speed/pace and time for this log are displayed and compared to that for the other activity on the same route and/or sharing the same tags using a box plot.
The above screenshot shows the speeds for that particular run using solid dots on the box plot, and indicates it was the fastest for that route when stops are removed, but that there was a long stop somewhere between the 8 and 10 km splits that made it the slowest over those distances (the smallest value is on the left of the graphs, so rightmost is best for speed and leftmost is best for pace.)
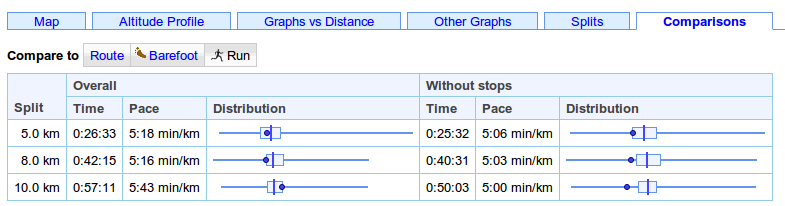
Comparing it to all the activity tagged with Run, not just along that particular route shows it was in the top 25% (after taking out the stop):
Some other recent updates to the site:
- Pages with many tabs will have some of the tabs hidden to save
space. Click the "more >>" button to show the rest.


- The unknown routes page now lets you filter by tag.
- When setting up a task for a goal, you can now filter the possible routes by place. This means that you can quickly find a route of the desired distance to complete the task and aren't overwhelmed by routes from places you don't need.
- There are a couple of QR Codes on the site now to help get the
urls into your mobile device. Scan the following QR
code to go to the mobile version of GPSLog Labs, for example.
There is also a QR code for the unique upload email address for your device on it's detail page.

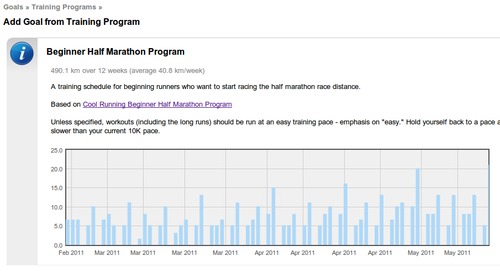
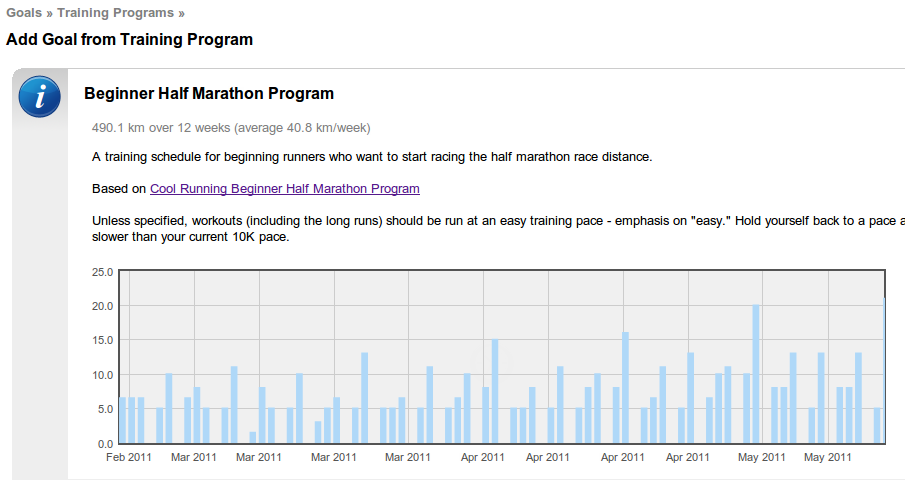
- When adding tasks from a training program to a goal, or
creating a new goal from a training program, you can now see a
preview graph of the tasks involved:
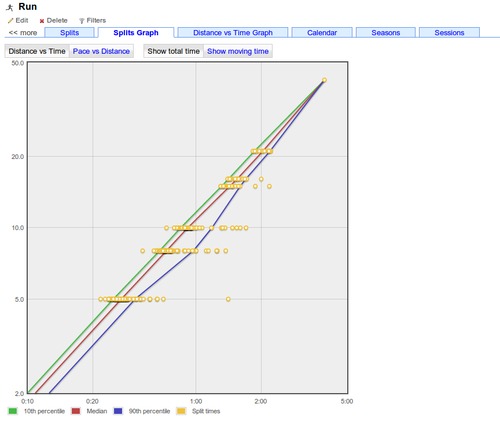
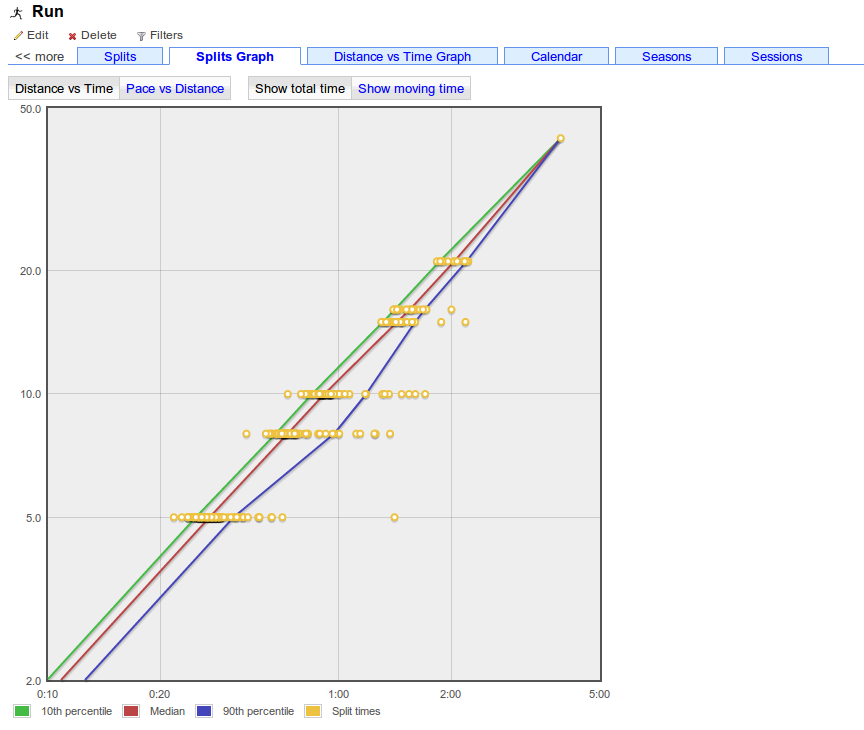
- The tag detail page has a new Splits Graph tab that shows a
graph of all the activity speeds/times at standard split distances,
together with lines indicating the distribution (10th, 50th, 90th
percentiles).
- The standard split distances now extend from 50km to 300km (50mi to 200mi) to make them more useful to cyclists and longer distance activities.
As always, please send feedback and suggestions to feedback forum.
| ← Previous post | Next post → |