GPSLog Labs Blog

GPSLog Labs Blog

New features and tips for using gpsloglabs.com

Distance split comparison table for routes

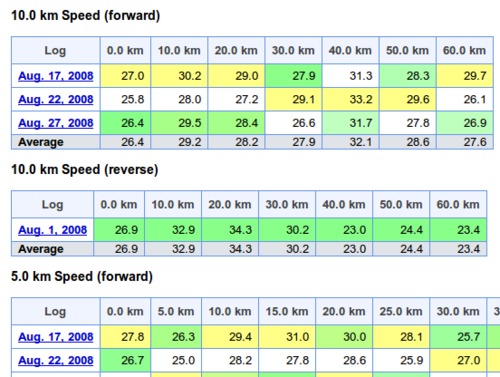
I've added a new tab to the route detail page in GPSLog Labs that compares the distance splits for all logs in the route.

This allows you to see the speeds over each section of the route for each log. Each column is coloured to indicated min/avg/max in white/green/yellow respectively. This allows logs that are faster or slower than normal to be easily identified.

For routes that display pace instead of speed, the pace over 1km (or mile) is displayed, i.e. for longer splits, it is not the time to cover the whole split distance.

Filed under  //  changelog   routes   splits   stats  

Updates for 22nd August

This post outlines a few of the recent updates to GPSLog Labs:

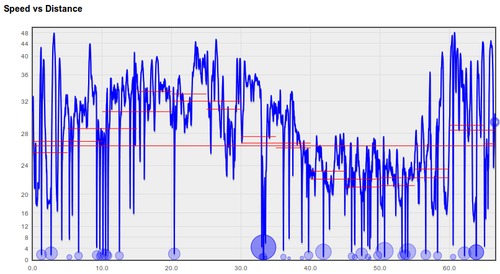
  • The average speed is now displayed for each 10km, 5km and 1km on the Speed vs Distance graph for a log. Likewise, for 10 minutes, 5 minutes and 1 minute on the Speed vs Time graph. As for the Splits, a maximum of 50 of these averages will ever be shown so the graph doesn't get too crowded.
  • The in page help has been changed so that the "bubble" now minimizes to a little blue question mark icon off to the right hand side of the page. This makes it easier to view it again if you need to get some help on something in particular on the page.
Filed under  //  changelog   graphs   help  

Update summary for 20th August 2009

This post outlines a few of the recent updates to GPSLog Labs:

  • I've added a "single page view" for a log that shows all the maps, graphs and tables that would be on separate tabs on a single page. This is best used for printing out the details of an activity as a PDF file (using something like PDFCreator) so they can be shared with other people.
  • I've improved the support for printing of pages (removing unnecessary borders, headers etc.)

    The best printer settings in FireFox appear to be about a 75% or so zoom, select "print background colours" (to show colours in tables of stats). You can also switch off headers and footers to clean up the output.

    In Internet Explorer, switching on printing of background colours and images is also necessary.

    Printing in Opera isn't really working. Graphs won't print, and the paths on maps don't print either.

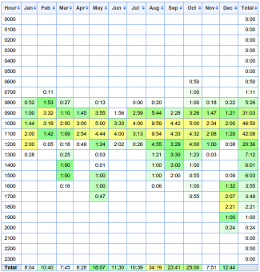
  • There is a new Seasons tab on the tag detail page that shows a table breaking down the activity for that tag by time of day and month of the year. This can be used to see how your activity varies with the seasons.
    Tag-seasons
  • New battery change selection page. When a battery cycle goes over 75% of the average for a device, a warning link on the home page will appear. There is a new page to allow easily selecting the point when batteries were changed or charged.
  • A summary of the current status of your goals (if you have created any) is now displayed in a "dashboard" on the home page.
  • Download graphs: Graphs now have a little "save" icon that appears when you hover over them with the mouse. Clicking this will download the graph as a PNG file. Unfortunately, this won't work in IE and the graph doesn't include the labels and legends, so it's not all that useful.
Filed under  //  batterycycles   changelog   graphs   printing   stats  

Map controls

There are a couple of not so obvious features on the maps that GPSLog Labs uses.

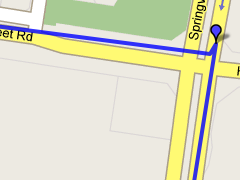
For speed reasons, the maps that are drawn have been "simplified", i.e. the number of points in the track has been reduced to speed up drawing and data transfer.

Unenhanced-map

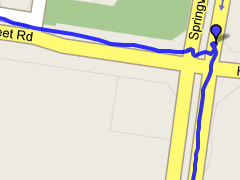
For most purposes, this will be fine, but if you want to zoom in and see the full detail of your track, there is a button on the map to "Enhance" the detail.

Enhance-map-screenshot-1

This will reload the page with the full log data mapped for the region displayed in the map. This means it's still pretty fast, but you can't pan too far or you'll need to click the enhance button again to reload more data.

Enhanced-map

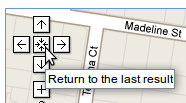
Additionally, on the built in pan tool is a "return to the last result" button. Clicking this will undo any zooming and panning you may have done and return the map to the original view when the page was loaded.

Return-to-last-result
Filed under  //  changelog   maps   tips  

Log thumbnails

GPSLog Labs uses thumbnail icons to help you identify your logged activity at a glance, without having to load the full map.

These thumbnails indicate scale by showing 1km grid lines. The start point of the log is marked as a small green square, the stop point as a small red square.

For example, the following thumbnail shows a log of approximately 65km:

Long-log-thumbnail

And one of 2km:

Short-log-thumbnail

In the inbox, "junk" logs will be indicated by half-size thumbnails:

Junk-thumbnail

Routes also show thumbnails of their altitude profiles. In these icons, the grid represents 10km along the horizontal axis, and 100m in the vertical axis.

For example, below is of a 70km log that climbs a 600m hill:

High-alt-thumbnail

And a 14km log with less than 100m altitude variation:

Low-alt-thumbnail

There are also "clock" thumbnail icons that indicate the duration of activity and sessions. These show a shaded segment on a 12 hour "clock", with a green marker for the start time, and a red marker for the stop time.

The icon below indicates a session that starts at 6:30 PM and goes for 3 hours until 9:30 PM:

Session-timethumbnail

If a log or session is longer than 12 hours, a thinner band indicates that it has "wrapped" around the clock. A session that starts at 6:30 PM and goes for 15 hours until 9:30 AM would have the following icon:
Long-session-timethumbnail
Filed under  //  changelog   inbox   thumbnails  

Internet Explorer 8 supported

After far to much trouble tracking down weird JavaScript errors and testing using an IE8 virtual machine, GPSLog Labs has been made IE8 compatible. If you're using IE8 and still notice any issues with the graphs or maps, please let me know.

Update: Ok, so the graphs don't work so well in IE. If there are a lot of points in a log (more than about an hour's worth), the graph may not draw properly. This is a bug in the library used to provide <canvas> support for IE. If you select a smaller range on the graph to zoom in then it'll show the graph data.

Filed under  //  graphs   ie8   internetexplorer   maps  

Simple log confirmation step

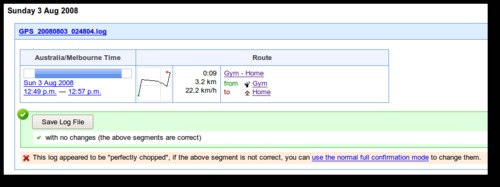
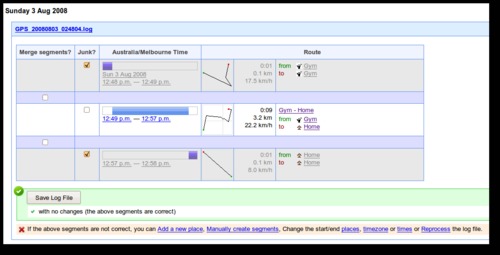
The GPSLog Labs inbox now has a "simple" confirmation mode for uploaded logs that appear to have been chopped "perfectly". e.g. for commutes between two places with no unrecognised or extra segments.

This means the inbox is less cluttered and there is less to think about to confirm those logs.

If you want to make a change, you can get back to the original view by clicking the "use the normal full confirmation mode" link:

Filed under  //  changelog   inbox   merge  

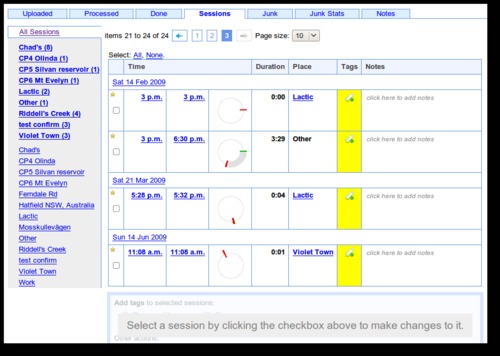
Inbox and Sessions

I've change the way that sessions are displayed and processed in the Inbox.

For a while now they have been shown together with logged activity. This meant it was easy to tag sessions and add notes to them, but generally you will only be interested in doing that to sessions at some places, and having to "mark as done" all the others was tedious.

So, sessions how have their own inbox tab. This tab will show all sessions by default, but it will also show the "unread" count per place on the left hand side, and clicking a place name will show only sessions at that place. This means that you can still pay attention to every session if you like, but you can also ignore sessions at certain places that you're not interested in. For example, you may want to add notes to sessions at the "Pool", but ignore those at "Home".

Filed under  //  changelog   inbox   sessions  

Log "time thumbnails"

Logs displayed in the inbox now have a "clock" that shows the start and stop times of the activity. This can be handy when trying to identify what the log was from by getting an idea of how the activity fitted into the rest of the day.

Filed under  //  changelog   inbox  

Timezone support changes

I've just spent some time refactoring GPSLog Labs so that it has much better support for logs in different timezones. For each log, you can specify the timezone that it was recorded in and it's times will be shown in that timezone no matter what your current timezone is set to, i.e. logs show the times you experience the activity.

The upshot of this is that if you were going for runs at 9am in one country, they'll appear at 9am when you compare them to runs in another country.

Filed under  //  changelog   timezone  
← Newer posts Older posts →

© 2013 Tom Paton | GPSLogLabs.com | Source | Feedback | RSS | Subscribe