GPSLog Labs Blog

GPSLog Labs Blog

New features and tips for using gpsloglabs.com

Filed under

stats

Updates for September 2nd

  • Support for the Nav N Go iGO 8 track format has been added. This looks like a pretty good app, but has a terrible name, not that I can talk...
  • Behind the scenes there's a new storage engine which will be able to handle a lot more growth in uploads. Let me know if you notice anything odd.
  • There's a new "smoother" design on the forms throughout the site:
    Screenshot-new-wizardstep-desi
  • The goal detail page now has a map tab.
  • The activity "Comparisons" tab has a new statistic: The split for the first and second halves of the activity. The theory is that if you've paced yourself properly and haven't slowed as you got tired this should be 0 or even negative.
    Screenshot-negative-split
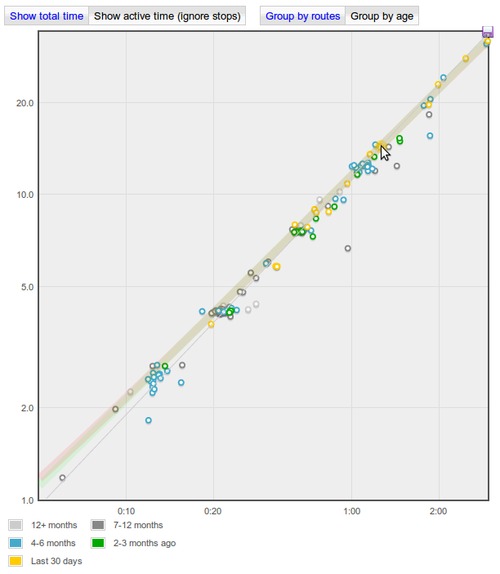
  • The Distance vs Time graphs on the tag detail and goal detail pages now have options to show the logs group by route (the default, and previous behaviour) or by "age". This will let you see how your performance has changed over time:
  • And, finally, it's now possible to upload a heart rate data file from a separate heart rate logger and have it stored together with the appropriate activity.

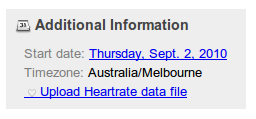
    On the activity detail page, there's a little link in the right hand side panel to "Upload Heart rate data file":

    Screenshot-upload-hr-link

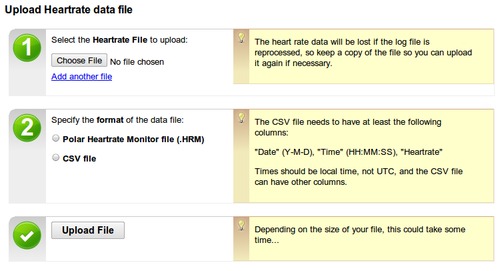
    Clicking that will give you a form where you can upload one or more heart rate log files in either Polar HRM or CSV formats:

    The original files aren't stored on the GPSLog Labs server though, so if you reprocess the log file (add a place, merge segments etc.) then you'll have to re-upload them.

Note that if you have enabled editing of heart rates for a tag, then the "Upload heart rate data file" link will be found on the Heart Rate tab of the activity detail page.
Filed under  //  changelog   graphs   heartrate   igo8   stats   upload  

Distance Finish Time Predictions

I've just added an experimental feature to GPSLog Labs to provide estimates of the finish times for different distances based on the activity you've logged. For example, this can take your pace from a 10km run and tell you how long it would take to do a half marathon, or take a target pace for a long distance and tell you how fast you should be aiming to do shorter training runs.

This is based on formulas developed many years ago by Peter Riegel and Dave Cameron by fitting a curve to the world record times for various distances. How well these apply to non-elite athletes is something I'm curious about, but the theory is that if you put 100% into running 10km, you'll do it in a certain time. If you put 100% into running 5km, you'll be able to go a certain amount faster as you only have to last half as long and vice versa for 20km. The ratio of speeds at different distances should be roughly right even if you're not breaking world records.

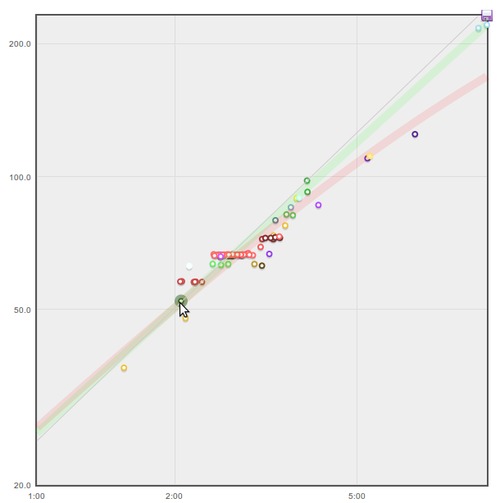
There are two places where this now appears in GPSLog Labs, the first is on an activity detail page's Comparisons tab and it extrapolates the pace (with and without stop time taken into account) to other distances:

The estimates using the two formulas are quite close until you get to very large distances, but you will hopefully be able to judge which is more appropriate for your activity.

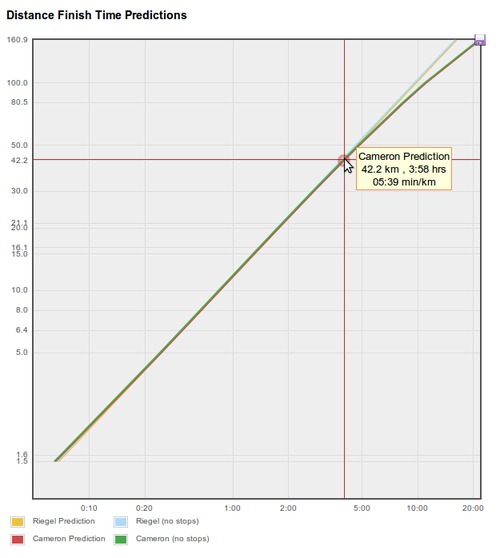
The second version is found on the Distance vs Time Graph tabs of the Tag detail and Goal detail pages. Move the mouse to set the speed to be extrapolated and the prediction curves will be overlayed on your actual recorded activity to see how they compare. The thin gray line is a linear prediction assuming your speed/pace won't vary as the distance increases or decreases. The red line uses Peter Riegel's model and the green line uses Dave Cameron's model. These estimates are often very similar and overlap simply appearing gray.

As far as I know, these formulas were developed for running, but the curves may be useful for other activity as well.

I'm very interested in knowing how this works for people, there are many other sites on the internet that will perform the same extrapolations if you manually key in your distance and time, so it's not just me interested in playing with this stuff!

Filed under  //  goals   graphs   predictions   stats   tags  

New GPS Track Filters

GPSLog Labs now has a powerful and customizable filtering feature to clean up errors in your logs caused by bad GPS signals.

There is a new menu option on the log detail page that will let you edit the filters applied to that log:

Screenshot-filter_menu

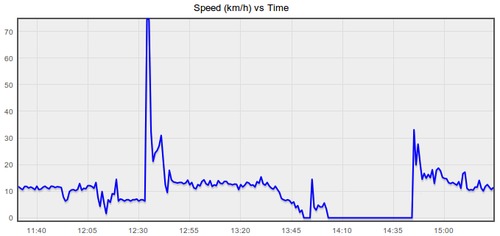
The following graph comes from a log recorded while running and shows the kind of noisy data that is often present. The incorrect speeds mess up the maximum speed, average speed and distance stats and often correspond to a bad trace on the map too.

Discard filters

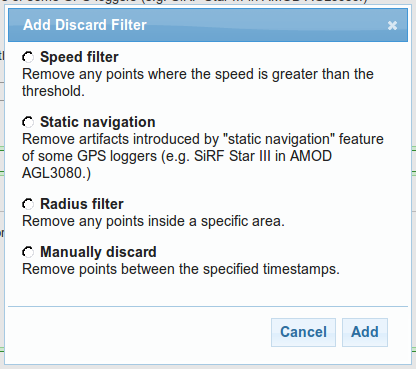
The first filters you can choose from will discard invalid points from your log and then interpolate the speed and course between the remaining points.

Screenshot-add_discard

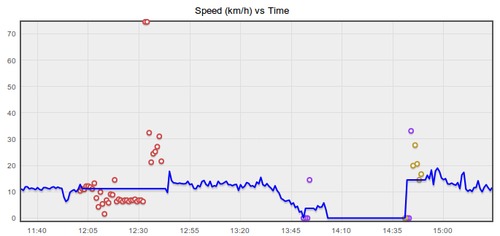
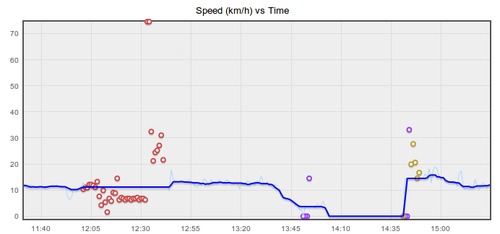
After applying those filters, the speed vs time graph looks a lot better (discarded points are colour-coded to match up with the chosen filters):

Post filters

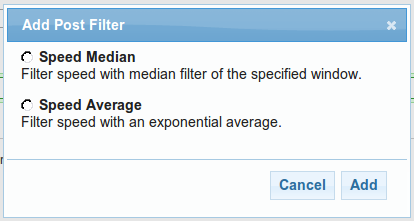
The second filtering stage applies an average function to the newly cleaned up data. Smoothing the speed graph will give you a more reliable average and maximum speed statistic and also improve the distance and time split data, but won't clean up the trace on the map or affect the total distance.

Screenshot-add_post

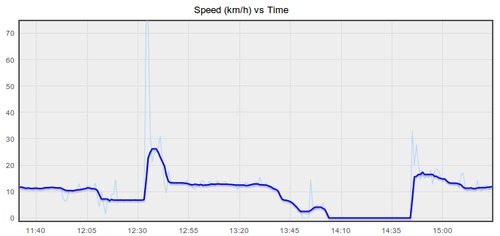
The original speeds are shown on the graph below as a light blue line, and after applying a median filter, the thick blue line has been smoothed (no discard filters were applied for this graph).

This graph shows the final results when both discard and post filters are applied:

Existing logs

The new filters will only take affect for new uploads, existing logs will retain the data from the old filter that GPSLog Labs used to apply until they are reprocessed.

Also, the discarded points from the old filter will no longer be shown on the Speed vs Time graph on the log detail other graphs tab. This information is only available now for logs using the new filter system from the Filters menu item.

Try it out

I suggest using a simple Speed Median filter initially, as that will clean out a lot of noise, setting the window time parameter to a larger value will smooth the speed more. I'll be describing the other filters in future posts.

As always, let me know if you have any difficulties or suggestions, and I hope this new feature helps you get more out of the site and your GPS logger!

Filed under  //  changelog   filters   graphs   stats  

Distance split comparison table for routes

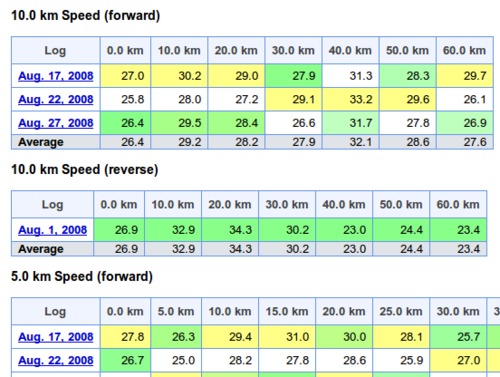
I've added a new tab to the route detail page in GPSLog Labs that compares the distance splits for all logs in the route.

This allows you to see the speeds over each section of the route for each log. Each column is coloured to indicated min/avg/max in white/green/yellow respectively. This allows logs that are faster or slower than normal to be easily identified.

For routes that display pace instead of speed, the pace over 1km (or mile) is displayed, i.e. for longer splits, it is not the time to cover the whole split distance.

Filed under  //  changelog   routes   splits   stats  

Update summary for 20th August 2009

This post outlines a few of the recent updates to GPSLog Labs:

  • I've added a "single page view" for a log that shows all the maps, graphs and tables that would be on separate tabs on a single page. This is best used for printing out the details of an activity as a PDF file (using something like PDFCreator) so they can be shared with other people.
  • I've improved the support for printing of pages (removing unnecessary borders, headers etc.)

    The best printer settings in FireFox appear to be about a 75% or so zoom, select "print background colours" (to show colours in tables of stats). You can also switch off headers and footers to clean up the output.

    In Internet Explorer, switching on printing of background colours and images is also necessary.

    Printing in Opera isn't really working. Graphs won't print, and the paths on maps don't print either.

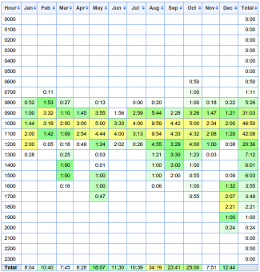
  • There is a new Seasons tab on the tag detail page that shows a table breaking down the activity for that tag by time of day and month of the year. This can be used to see how your activity varies with the seasons.
    Tag-seasons
  • New battery change selection page. When a battery cycle goes over 75% of the average for a device, a warning link on the home page will appear. There is a new page to allow easily selecting the point when batteries were changed or charged.
  • A summary of the current status of your goals (if you have created any) is now displayed in a "dashboard" on the home page.
  • Download graphs: Graphs now have a little "save" icon that appears when you hover over them with the mouse. Clicking this will download the graph as a PNG file. Unfortunately, this won't work in IE and the graph doesn't include the labels and legends, so it's not all that useful.
Filed under  //  batterycycles   changelog   graphs   printing   stats  

Life logging

There's an interesting article in Wired: Know Thyself: Tracking Every Facet of Life, from Sleep to Mood to Pain, 24/7/365

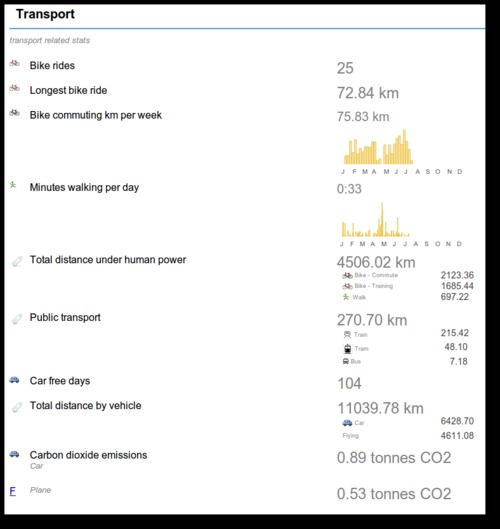
This gives a nice overview of life logging, something which I'm building GPSLog Labs to do. GPSLog Labs helps quantify a lot of your daily activity based on GPS tracks recorded with cheap and simple GPS data loggers. By simplifying the process of analysing these logs it's possible to not just get total mileage you've traveled, but also the amount of time you spend at different places and doing different activities.

While it can't yet come close to something as comprehensive (and nice to look at) as the Feltron Annual Report, the GPSLog Labs reports are heading in that direction. The summary of your collected data can be exported in CSV format if you're keen enough to want to make something that looks really good!

Filed under  //  lifelogging   reports   stats   tips  

Summary of activity for all GPSLog Labs users

There's a new publicly accessible page that shows the total activity of all GPSLog Labs users, broken down by day of week, month, and time of day.

Filed under  //  changelog   stats  

Summary stats by time of day

I've just added a new breakdown by time of day on the stats summary page. This will show your total activity logged by the hour of the day when the activity started. It also breaks out the times by tags and places, the same as the by day of week and month breakdowns. It is interesting to see how your commute times, exercise times, vehical usage patterns vary.

Filed under  //  changelog   stats  

© 2013 Tom Paton | GPSLogLabs.com | Source | Feedback | RSS | Subscribe