GPSLog Labs Blog

GPSLog Labs Blog

New features and tips for using gpsloglabs.com

Filed under

batterycycles

Upload form redesign and a bit about Devices

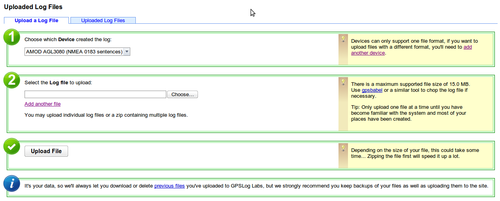
I've changed the GPSLog Labs upload form a little, partly to make it nicer looking and less cluttered, but mostly to make the purpose of Devices a little clearer.

Previously, the choice of device to upload to wasn't shown on the form if you had only one device, and now it will always be given.

To process the log files you upload, the system needs to know what the format of the file is. When you first upload a file, there is a page that automatically detects this format, but that isn't practical to do for every file that is uploaded, so the setting is stored in a "device". This means that each device can handle one format only, and therefore, if you want to upload files with a different format you'll need to create another device to do so.

The other purpose of devices is to track battery life. If you upload all logs you record, then GPSLog Labs knows how long your logger has been switched on so can predict how much time you have before you need to recharge/replace your batteries and therefore prevent you getting a flat battery in the middle of an activity, which can be rather frustrating!

When the logged usage goes over 75% you'll get a warning:

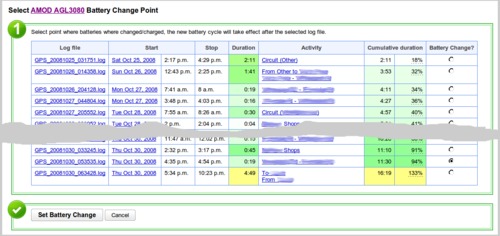
Marking the point where you recharged or replaced your batteries is easy too:
Filed under  //  batterycycles   changelog   devices   log formats   tips   uploading  

Update summary for 20th August 2009

This post outlines a few of the recent updates to GPSLog Labs:

  • I've added a "single page view" for a log that shows all the maps, graphs and tables that would be on separate tabs on a single page. This is best used for printing out the details of an activity as a PDF file (using something like PDFCreator) so they can be shared with other people.
  • I've improved the support for printing of pages (removing unnecessary borders, headers etc.)

    The best printer settings in FireFox appear to be about a 75% or so zoom, select "print background colours" (to show colours in tables of stats). You can also switch off headers and footers to clean up the output.

    In Internet Explorer, switching on printing of background colours and images is also necessary.

    Printing in Opera isn't really working. Graphs won't print, and the paths on maps don't print either.

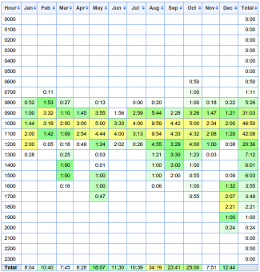
  • There is a new Seasons tab on the tag detail page that shows a table breaking down the activity for that tag by time of day and month of the year. This can be used to see how your activity varies with the seasons.
    Tag-seasons
  • New battery change selection page. When a battery cycle goes over 75% of the average for a device, a warning link on the home page will appear. There is a new page to allow easily selecting the point when batteries were changed or charged.
  • A summary of the current status of your goals (if you have created any) is now displayed in a "dashboard" on the home page.
  • Download graphs: Graphs now have a little "save" icon that appears when you hover over them with the mouse. Clicking this will download the graph as a PNG file. Unfortunately, this won't work in IE and the graph doesn't include the labels and legends, so it's not all that useful.
Filed under  //  batterycycles   changelog   graphs   printing   stats  

© 2013 Tom Paton | GPSLogLabs.com | Source | Feedback | RSS | Subscribe