GPSLog Labs Blog

GPSLog Labs Blog

New features and tips for using gpsloglabs.com

Filed under

editing

Updates for May 25th

As noted earlier, now that GPSLog Labs has been migrated to the new server and updated to newer library versions, there has finally been some time to add new features:

  • Sharing Routes between multiple places.

    See the next post on Merging Routes for details.

  • View best efforts in crossfilter.

    Tag crossfilters have got a bit more powerful and can now include best effort times.

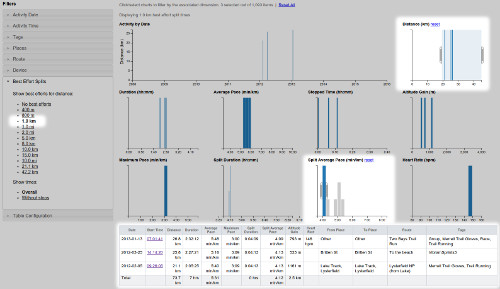
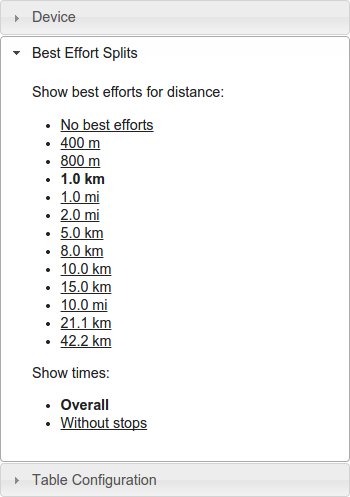
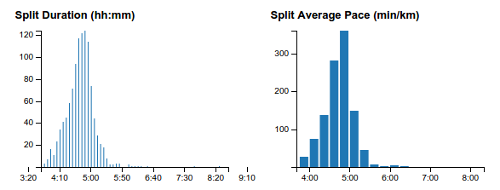
    For example, to answer questions such as "what's the fastest I've run 1km when doing long runs?", select the distance from the Best Efforts Splits filter:

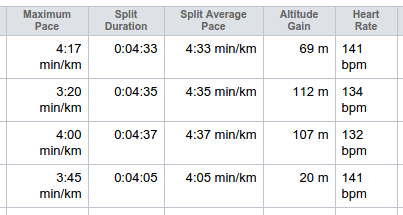
    This will add Split Duration and Split Average Speed/Pace graphs to the dashboard and table:

    You can filter using the charts to select just "long" runs and "fast" best efforts:

  • Suggested edits.

    This one is a little experimental and I'll be refining it I'm sure. The idea is that GPSLog Labs will remember the edits you make to your uploaded activity (fixing unmatched places, assigning routes and tags) and speed up the editing process the next time by providing suggestions where it can.

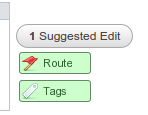
    When GPSLog Labs can provide a suggested edit, a button will be displayed next to the activity:

    Selecting an option from the suggested edits will apply updates to the tags, route and start/stop places as necessary.

  • Activity feed projections iCal feed.

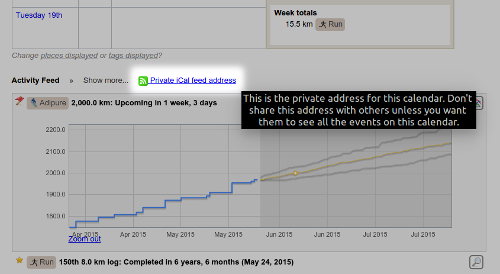
    The Activity Feed on the home page displays dates you're projected to hit various milestones (distances, counts and goals) but it's pretty easy to overlook something interesting that's coming up.

    Now there's an iCal feed url you can add into your calendar to see these projections on your phone or somewhere else convenient so you can get a little kick of motivation when you're about to pass the milestone.
Filed under  //  changelog   routes   bestefforts   editing   crossfilter   activityfeed   icalendar  

Updates for August 25th

Some recent (and some not so recent) updates to GPSLog Labs:

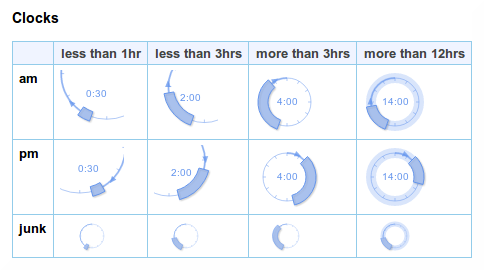
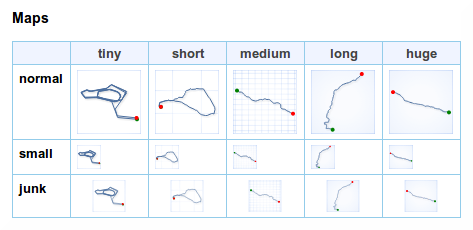
  • New clock, altitude profile and map thumbnails.

    The thumbnail images have a new updated look that is smoother and more detailed. They are also rendered in the browser, rather than being downloaded, which speeds up the display of the pages.

    The clocks now "zoom in" when indicating short durations to make the most of the available space and show the duration in hours and minutes too. A duration of greater than 12 hours is indicated by shading the full circle.

    An arrow indicates whether the time is a.m. or p.m. (the arrow points from the start or end time to noon).

    Times for "junk" activity are shown in a small and simplified thumbnail.

    Altitude thumbnails simply show the profile, with distance grid lines every 10km and altitude grid lines every 100m.

    Map thumbnails have a 1km grid to indicate scale, and show the start location as a green dot and the end location as a red dot.

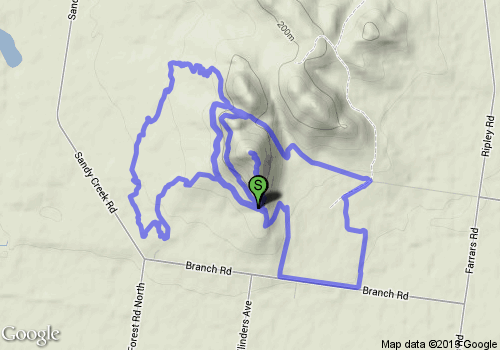
  • You can now generate a Google "static map image url" for an activity via the Activity detail "Share Log" page. I.e. a simple image file that can be downloaded or added to a page and it doesn't require any scripting to make it work.

    This feature is only available for shared activity, but once the url has been generated or the image downloaded, the activity can be made private again.

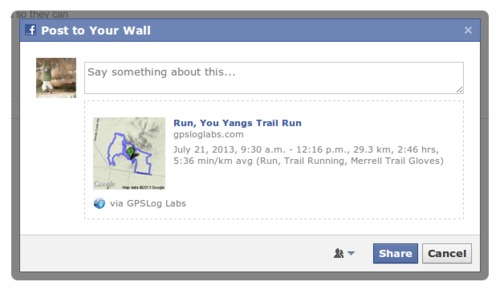
  • The thumbnail for activity you share to your Facebook timeline is now a small "terrain" map. This looks nicer and has more detail than the old icon.

  • Activity tags are now sorted by overall frequency, not just alphabetically. This makes the titles of pages (particularly shared activity and posts to Facebook etc.) more sensible as the primary activity tag is likely to be first (e.g. "Bike" or "Run") followed by any minor tags (e.g. shoe type or bike being used).

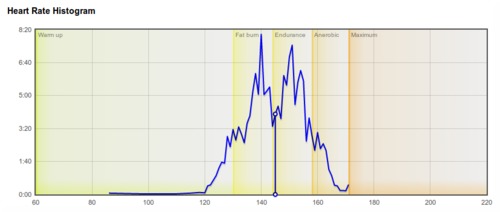
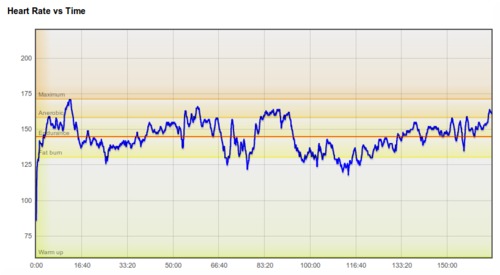
  • I've added shading on activity heart rate graphs to indicate hear rate zones:

    An earlier post has details on setting up heart rate zones for your tags.

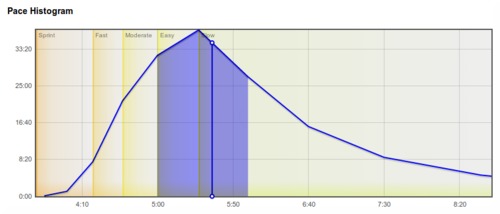
  • Likewise, there is also shading on activity speed graphs to indicate speed zones if you have them configured.

    There are links under these graphs to take you to the zone configuration if you haven't yet set up speed zones (or heart rate zones).

  • A bug that meant times weren't working properly for non-English dates on the manually create segments page has been fixed. Note, this page still won't work properly for very long files/segments. It's probably best that those are edited using gpsbabel before uploading to GPSLog Labs.

    This page has also been updated with the new layout.

Filed under  //  changelog   graphs   maps   filters   editing   facebook   sharing   thumbnails   time filter   tags   heartrate  

Updates for June 26th

This is a quick summary of the recent updates to GPSLog Labs:

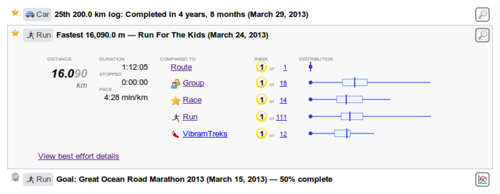
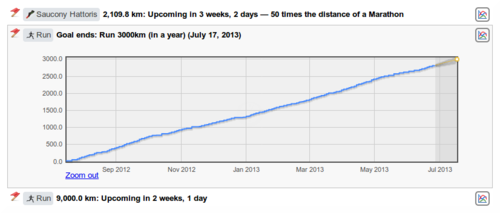
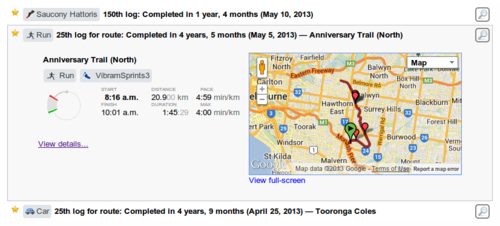
  • The new "Activity feed" has had some extra elements added to help you be aware of recent and upcoming significant achievements:

    • Best Efforts — This will show your fastest times at benchmark distances (e.g. 10km)

    • Goals — Progress towards a goal will be indicated as you pass 50% and 100% of your target distance, and also as you get half way through the goal period and when you complete the goal.

    • Activity counts — e.g. the 10th or 100th log for a given tag, route or distance.

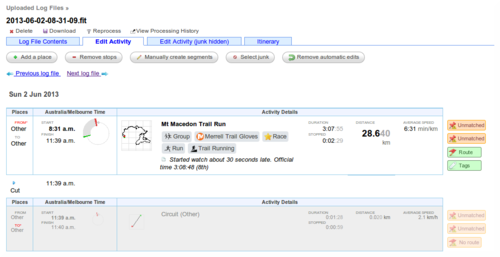
  • New layout for log file editing page:

    Hopefully this is a more logical layout that includes a few more details and removes a few things that no longer made sense. Some of the popups on this page have some small improvements too.

  • There's now a Russian translation of the help pages. Many thanks to Michael.
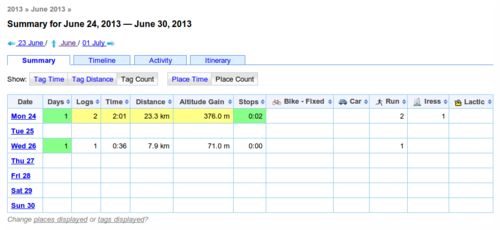
  • Added "Place Count" and "Tag Count" as options for displaying calendar summary tables.

  • Added nautical miles as an option for the distance/speed format settings.
  • Added a csv download for data from the session detail tables (e.g. from the Sessions tab on the Place or Tag detail pages.)
  • Fixed a bug with Facebook sharing.
Filed under  //  changelog   goals   bestefforts   activityfeed   editing   translation  

Updates for December 7th

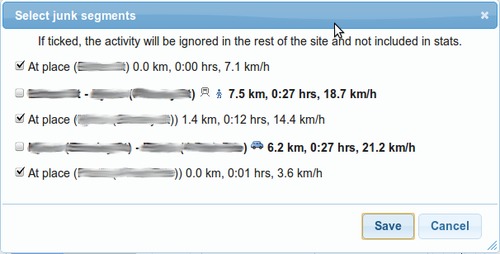
  • There's another new button on the edit Log File tab exposing a feature that was previously a little too well hidden, this time to select which segments should be marked as "junk":

    That brings up a popup where you can quickly choose which segments are junk (and therefore shouldn't be displayed in the rest of the site) and which have the activity you're interested in:

  • The colour of the junk segments on that page has been changed subtly from red/orange to a more neutral gray too.
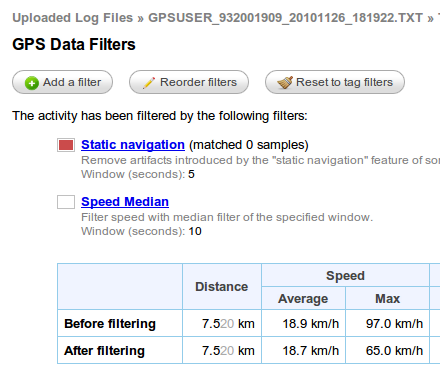
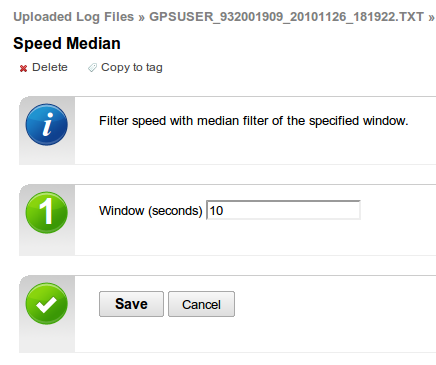
  • The GPS Data Filters page has been completely overhauled too so it should hopefully be a bit easier to use and faster to add certain type of filters too.

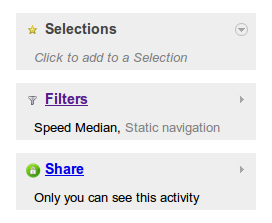
    Click on the Filters side panel of an activity you want to filter:

    Screenshot-log-panel-filters
    The GPS Data Filters page now has clearer menu options and a bigger preview maps and graphs to show the results of the filters you have applied:
    Screenshot-log-filters-view
    And the individual filter pages now have more space to show their options and view the maps and graphs:
    Screenshot-log-filters-edit
  • The Time filter now has a preview map to show you the segment that is being discarded.
  • Most filters now have a "Copy to tag" menu option that will let you copy the filter and it's parameters to a tag. This means that once you find a good combination of filters to clean up your activity, you can have them automatically applied to all data you upload from now on tagged with that tag.
Filed under  //  changelog   editing   filters   junk  

Updates for December 1st

Recent changes in GPSLog Labs have focused on improving the log file editing process:

  • The Add a Place, Remove stops and Manually create segments commands on the Log File edit page have been changed from menu options to more prominent buttons:
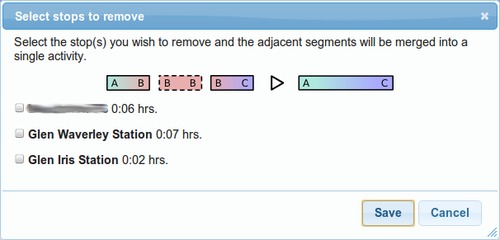
  • Remove stops is a new command that allows you to quickly and easily remove unwanted stops from a Log File. Multiple stops can be removed in one step which is easier than removing each stop or cut in turn.
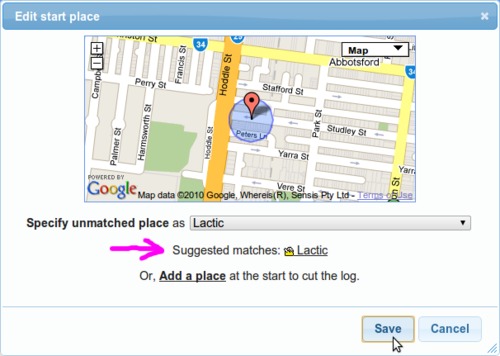
  • When specifying an unmatched place, previous activity is now used to provide a suggestion of likely places it could be from those in the neighbourhood of the start location:
  • The Reprocess confirmation page has also been redesigned and the page sequence after queuing a file for reprocessing has been improved.
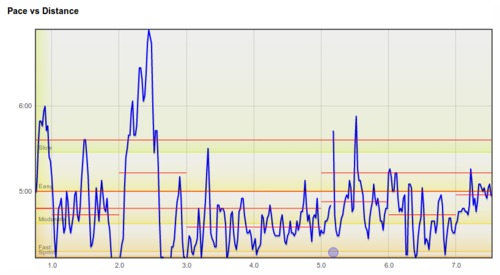
  • The Speed/Pace vs Distance graphs on the activity detail page (Graphs vs Distance tab) now have a new "scaling" algorithm that isn't as extreme and should make pace graphs easier to read.
  • There's also a new link at the bottom of the route Altitude Profile tab to show all altitude profile thumbnails for all logs. This is useful for circuits so you can easily check they are all correctly marked as forward or reversed direction.
Filed under  //  changelog   editing   graphs   processing  

© 2013 Tom Paton | GPSLogLabs.com | Source | Feedback | RSS | Subscribe