GPSLog Labs Blog

GPSLog Labs Blog

New features and tips for using gpsloglabs.com

Filed under

changelog

Upload processing redesign

Well, the inbox redesign mentioned a few weeks back turned out to take longer than planned, but the end result is a huge improvement in the way you manage your log files with GPSLog Labs and the "inbox" doesn't really exist anymore.

I'll post a quick tutorial soon to show the basic steps involved in uploading a log and processing it, but for now, a summary of some of the major changes are as follows:

  • Activity is automatically extracted from uploaded log files and no longer needs to be "confirmed" before it shows up in the rest of the site.
  • You get much more direct control over the editing of the extracted activity.
  • Places will automatically be created based on your uploaded logs.

This last one is a biggy and results in a big change to the way you use GPSLog Labs. GPSLog Labs now "asks for forgiveness, not permission" and will create a new place whenever a log starts or stops in a location that can't be matched to an existing place. This means that you can get up and running with the site much more quickly.

When GPSLog Labs creates a place, you can either give it a name and keep it or if you don't want a place at that location, you can swap it for the correct place that should have matched.

Filed under  //  changelog   inbox   places   uploading  

Inbox redesign stage 1

Just a quick note to say that the first phase of the redesign of the GPSLog Labs Inbox is now live.

The tabs have been renamed and some of the less used tabs have been changed to links at the bottom of the main remaining tabs.

There'll be some more big changes soon, until then, the documentation is going to be a little out of date. Please contact me if you get stuck anywhere and need some assistance before then.

Filed under  //  changelog   documentation   help   inbox  

Log Timezone Changes

I've just changed the way that GPSLog Labs detects the local timezone for a log to make it more reliable.

Each place now has a timezone field and this is used to set the default timezone for any logs to or from that place (kind of obvious really...)

When you're adding a new place, you can choose the timezone or just click the "Auto-detect" button which will use the geonames.org web-service to determine the timezone.

I have been able to fill in most timezones for places that have been created to date. Have a look at the Places configuration page though as you may have one or two that you'll need to set yourself.

If a log doesn't match any places it will default to the timezone you've set in your Profile page, and the timezone for a log can always be edited if you want it to be something different.

Filed under  //  changelog   inbox   places   timezone  

Updates for September 10th

This post outlines a few of the recent updates to GPSLog Labs:

  • I've added a new menu to the uploaded log files in the Inbox confirmation stage. This allows you to quickly perform tasks on the uploaded log file should you need to by simply moving the mouse over the log file heading:
  • Graphs now shade the middle two quartiles of the data, instead of showing +/- one standard deviation, where the distribution is not Gaussian. i.e. everywhere except distances along a single route. Blame Nassim Nicholas Taleb.
  • There's a Battery Cycle Duration vs Date graph on the device's Battery Life Graph tab as I was curious to see if my batteries might be deteriorating with age (they're not yet.)
  • There's a new Total Stop Time vs Date graph on the route detail Stops tab. This can show you if your amount of stopped or resting time is changing over time.
  • Goal graphs now have a dot showing the required amount to meet your target in the remaining time. The lines show the overall average so far (blue) and the average target required (orange), the dots reflect what you need to do per week/month to meet the target based on what you've done so far and how much time you have remaining:
  • Goals are now shown on the week's activity "dashboard" on home page. This lets you see at a glance how you're tracking against the goals and plan what to do next:
    Goal_homepage
    This shows: the goal title, the difference between your actual activity and the goal target to date, the total activity counting towards the goal this week, a percentage comparison to the weekly target.
    Under the total goal activity for the week are coloured indicators to show what day the activity occurred on. The most recent day is on the right in green, the oldest in orange on the left.
Filed under  //  changelog   goals   graphs   inbox  

IPhone interface

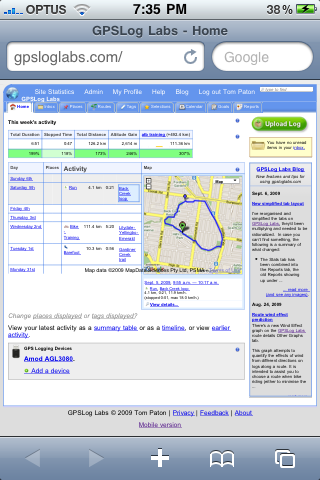
GPSLog Labs works quite well on the iPhone, but it's not a truly useful mobile experience:

Img_0401

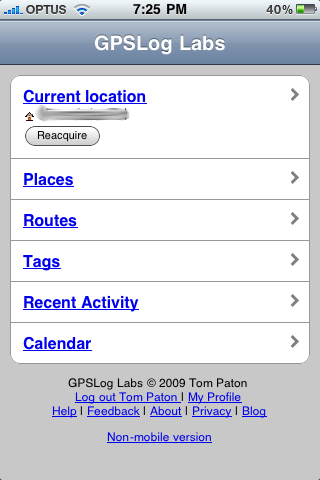
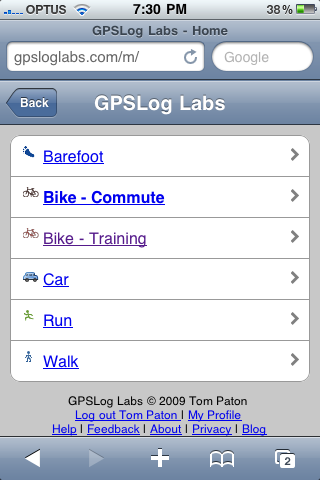
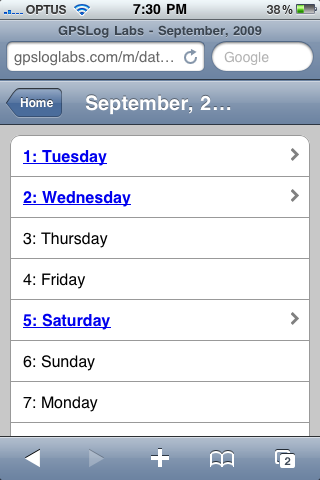
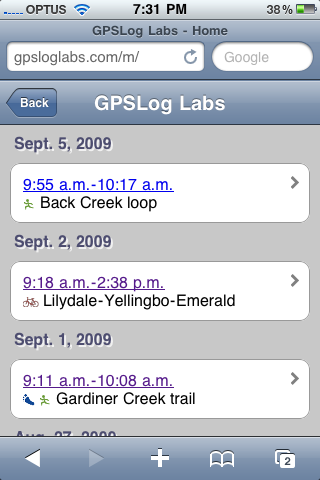
So, I've added a mobile version of the site:

Img_0389

It will take advantage of the GPS in the phone (if available) to show you information in GPSLog Labs that's relevant to your current location (if it can recognise it) and you can also add new places into GPSLog Labs directly from the phone while you're at the place. Meaning logs you upload later will be automatically chopped without you having to edit them.

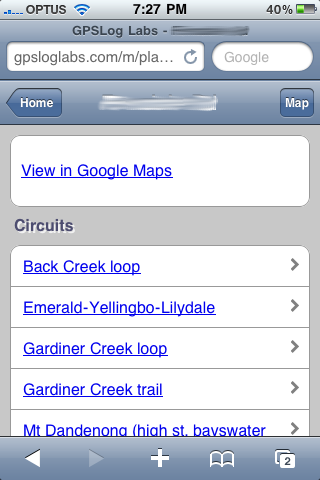
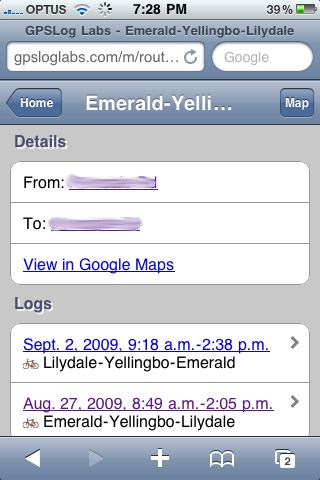
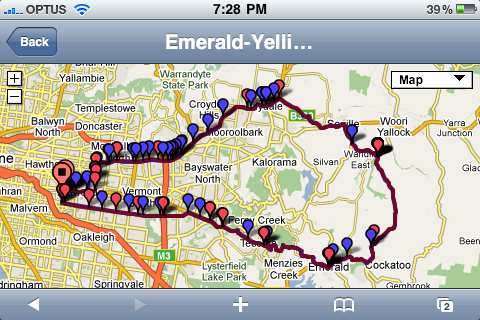
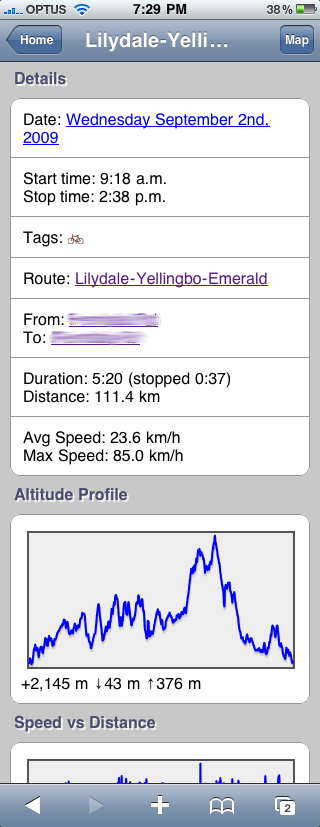
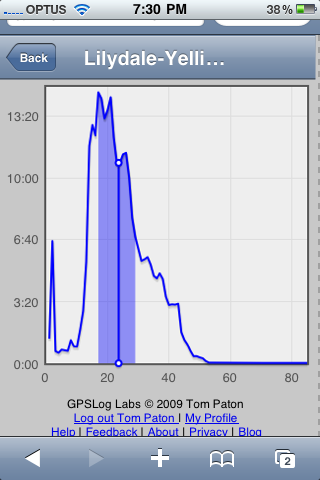
You can quickly browse through the logs you've uploaded, view their stats, maps and graphs:

Img_0390
Img_0393
Img_0394
Img_0396
Img_0397
Img_0398
Img_0399
Img_0400

This is just the beginning, expect a lot more useful features soon (and let me know if you've got any ideas too!)

Filed under  //  changelog   iphone   mobile version  

New simplified tab layout

I've reorganised and simplified the tabs on GPSLog Labs, they'd been multiplying and needed to be rationalized. In case you can't find something, the following is a summary of what changed:

  • The Stats tab has been combined into the Reports tab, the old Reports showing up under the Custom Reports subsection.
  • Your Devices are now shown at the bottom of the home page, rather than on their own tab.
  • There's an Upload button on the home page now, and no longer and Upload tab.

The home page has had a bit of a shake up too, moving the Inbox summary to the right hand panel.

Filed under  //  changelog  

Route wind effect prediction

There's a new Wind Effect graph on the GPSLog Labs route details Other Graphs tab.

This graph attempts to quantify the effects of wind from different directions on logs along a route. It is intended to assist you to choose a route when bike riding (either to minimise the effect of the wind or to maximise it if you're keen!)

There are 4 lines plotting the relative effect on the overall average speed for the route for different wind strengths. The units are relative and indicative only.

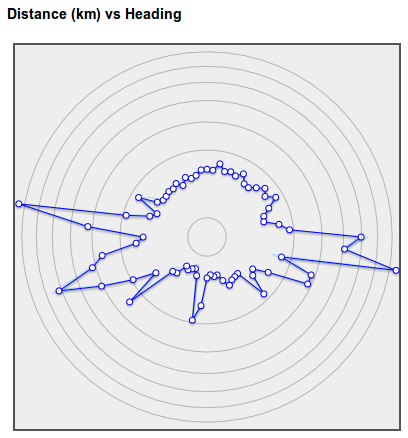
For example, for a log such as the following (predominantly traveling in an east-west and west-east direction):

Route-wind-effect-1a

The computed Wind Effect indicates that the greatest effect will be when the the wind is from the east or west, and the minimum when the wind is from the north or south:

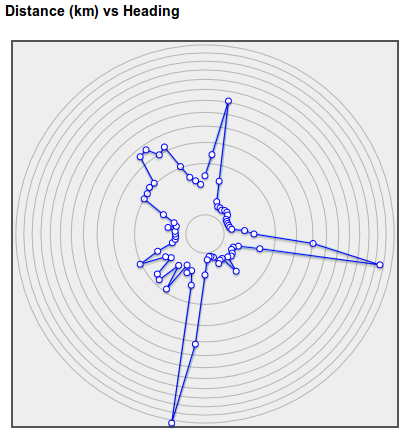
For a route which has a less symmetrical profile, with long sections traveling east and south:

Route-wind-effect-2a

The computed wind effect is more even, but there is a definite advantage when the wind is coming from the west:

The wind model used is pretty primitive and assumes that a headwind has the same effect on your speed as a tailwind, but it's better than nothing. If anyone knows of any more sophisticated models that could be used, I'd be happy to look into it.

Filed under  //  bike   changelog   graphs   routes   wind  

Sunrise/set times displayed in timeline views

The sunrise and sunset times are now displayed in the GPSLog Labs timeline views (for a date, week or log file.)

The location of the sunrise/set is taken from the starting location of the first log of each day, so may jump around a little (as the times vary quite a bit according to your latitude and longitude.)

Filed under  //  changelog   sunrise   sunset   timeline  

Distance split comparison table for routes

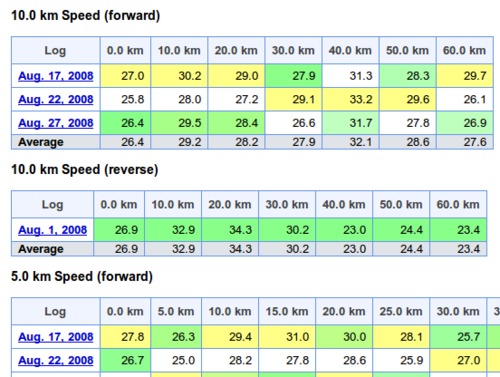
I've added a new tab to the route detail page in GPSLog Labs that compares the distance splits for all logs in the route.

This allows you to see the speeds over each section of the route for each log. Each column is coloured to indicated min/avg/max in white/green/yellow respectively. This allows logs that are faster or slower than normal to be easily identified.

For routes that display pace instead of speed, the pace over 1km (or mile) is displayed, i.e. for longer splits, it is not the time to cover the whole split distance.

Filed under  //  changelog   routes   splits   stats  

Updates for 22nd August

This post outlines a few of the recent updates to GPSLog Labs:

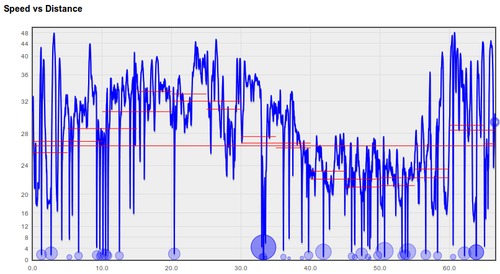
  • The average speed is now displayed for each 10km, 5km and 1km on the Speed vs Distance graph for a log. Likewise, for 10 minutes, 5 minutes and 1 minute on the Speed vs Time graph. As for the Splits, a maximum of 50 of these averages will ever be shown so the graph doesn't get too crowded.
  • The in page help has been changed so that the "bubble" now minimizes to a little blue question mark icon off to the right hand side of the page. This makes it easier to view it again if you need to get some help on something in particular on the page.
Filed under  //  changelog   graphs   help  
← Newer posts Older posts →

© 2013 Tom Paton | GPSLogLabs.com | Source | Feedback | RSS | Subscribe