GPSLog Labs Blog

GPSLog Labs Blog

New features and tips for using gpsloglabs.com

Filed under

maps

Sharing your logs

By default all the activity you upload to GPSLog Labs is private and visible only to you.

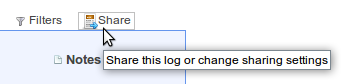
If you want to share maps and graphs of your activity with your friends click the Share button to enable sharing:

Screenshot-sharing-1

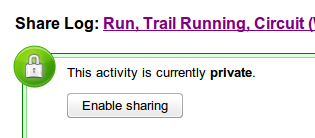
Then click the Enable sharing button:

Screenshot-sharing-2

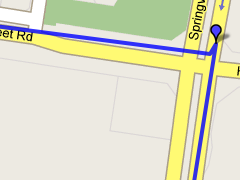
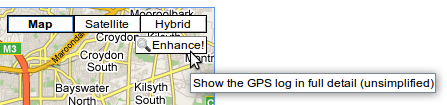
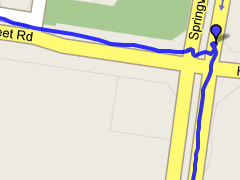
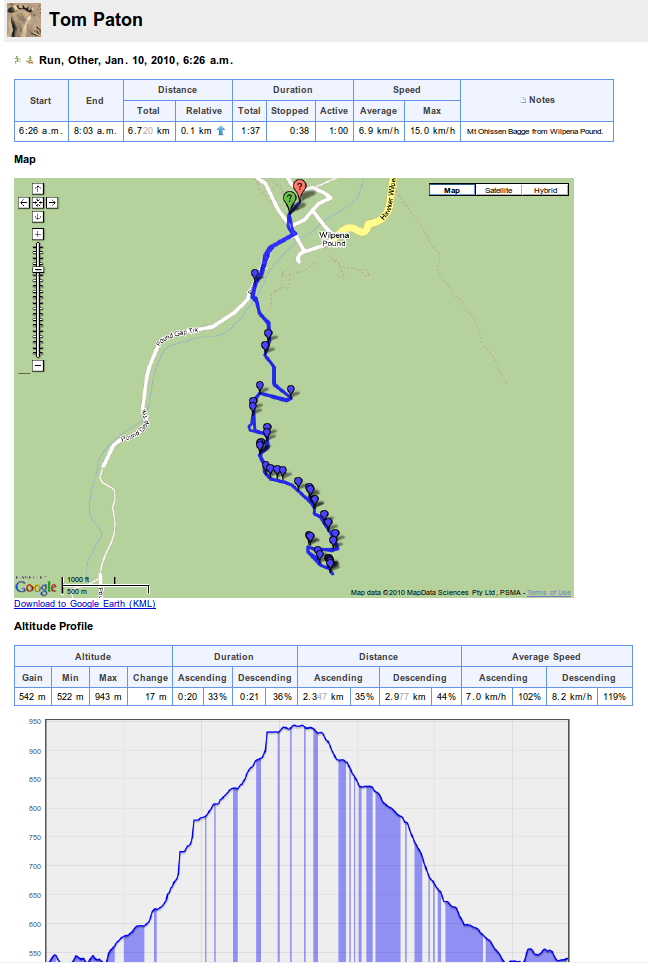
This will generate a publicly accessible detail page:

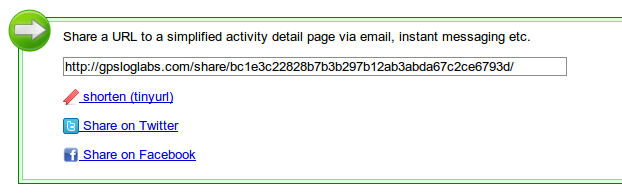
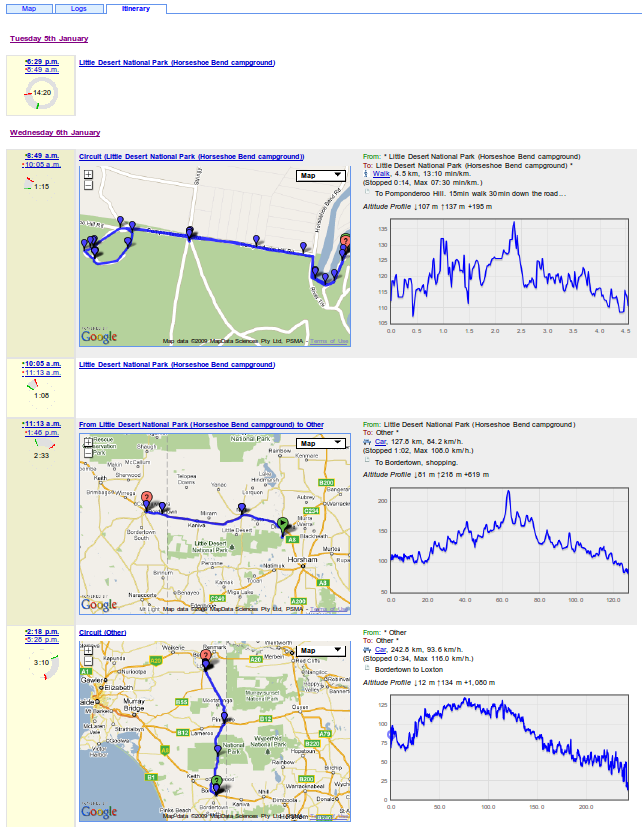
Which will look like this (actual link):

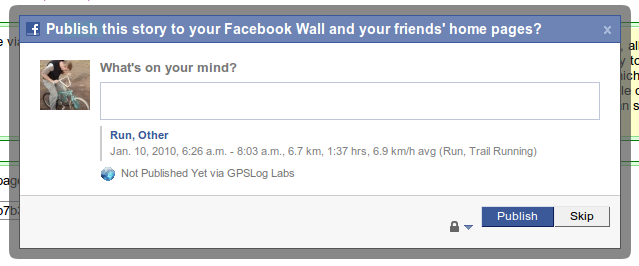
You can share the URL to this page on Twitter, Facebook, email, IM or wherever you like, for example, clicking the Share on Facebook link will open a window which will let you customize a message and publish a link to your activity on your Wall:

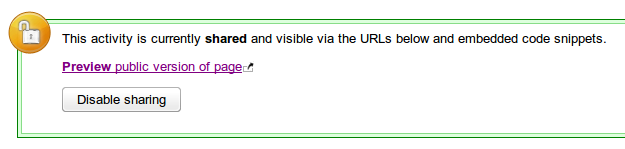
At any time, you can click the Disable sharing button to hide the activity if you change your mind.

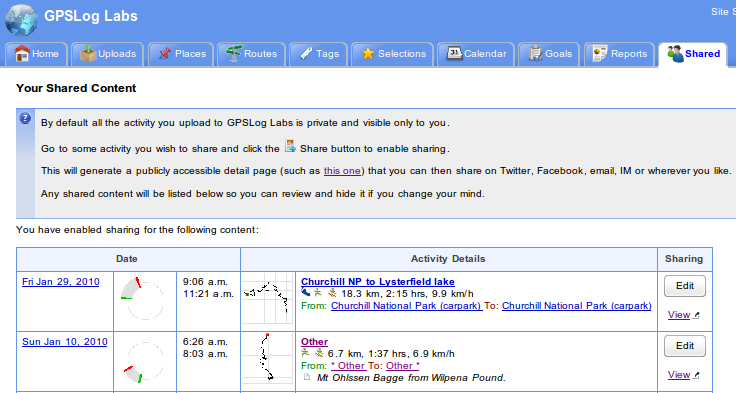
Any shared content will be indicated by a "sharing" icon

Shared

and will be listed on the Shared tab so you can review it.

I'll be adding the ability to share more kinds of content soon but if you have anything you'd like to see in particular, please let me know.

Filed under  //  changelog   facebook   graphs   maps   sharing   twitter  

New Itinerary view

The day and week calendar views of your activity on GPSLog Labs now have a new Itinerary tab. This isn't the best name, as it shows what you did, not what you plan to do, but you get the idea.

In this view, all activity (and sessions) are displayed one under another with their own maps and altitude profile graphs.

Having their own maps means that short activity isn't invisible at the scale required to show longer activity.

Filed under  //  changelog   itinerary   maps  

Map controls

There are a couple of not so obvious features on the maps that GPSLog Labs uses.

For speed reasons, the maps that are drawn have been "simplified", i.e. the number of points in the track has been reduced to speed up drawing and data transfer.

Unenhanced-map

For most purposes, this will be fine, but if you want to zoom in and see the full detail of your track, there is a button on the map to "Enhance" the detail.

Enhance-map-screenshot-1

This will reload the page with the full log data mapped for the region displayed in the map. This means it's still pretty fast, but you can't pan too far or you'll need to click the enhance button again to reload more data.

Enhanced-map

Additionally, on the built in pan tool is a "return to the last result" button. Clicking this will undo any zooming and panning you may have done and return the map to the original view when the page was loaded.

Return-to-last-result
Filed under  //  changelog   maps   tips  

Internet Explorer 8 supported

After far to much trouble tracking down weird JavaScript errors and testing using an IE8 virtual machine, GPSLog Labs has been made IE8 compatible. If you're using IE8 and still notice any issues with the graphs or maps, please let me know.

Update: Ok, so the graphs don't work so well in IE. If there are a lot of points in a log (more than about an hour's worth), the graph may not draw properly. This is a bug in the library used to provide <canvas> support for IE. If you select a smaller range on the graph to zoom in then it'll show the graph data.

Filed under  //  graphs   ie8   internetexplorer   maps  
← Newer posts

© 2013 Tom Paton | GPSLogLabs.com | Source | Feedback | RSS | Subscribe