Updates for April 25th
Here are some "new" features in GPSLog Labs that I hadn't had a chance to post about yet:
-
The Tag Activity Feed is a list of completed and projected distance milestones for each tag, such as completing 1000 km (or miles):
The projections are computed with a Monte Carlo simulation based on your logged activity. The graph shows your cumulative distance and the range of likely outcomes, with the projected date taken at the median.
A selection of these milestones may be displayed on the home page below the activity table to let you know of targets you have recently completed or will hit soon.
-
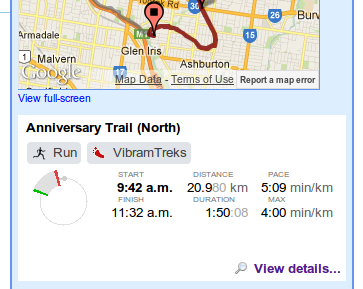
The log detail page now shows the longest best effort at the top of the page:
This lets you see at a glance how well the activity compares to others with the same tag and on the same route, and you can click through to view the other distances on the Comparisons tab.
-
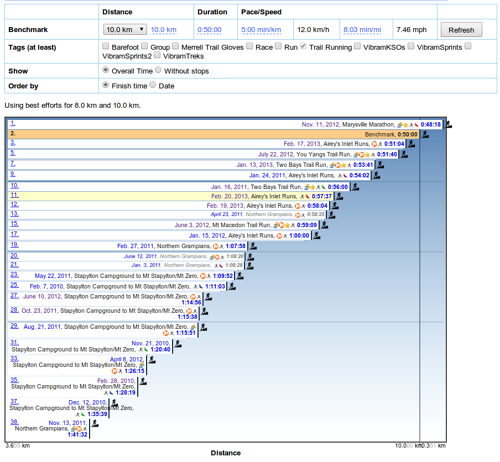
The Virtual Race allows you to see the result of a hypothetical race between all your efforts for a particular set of tags.
You can find the Virtual Race tab on the tag detail page, and there you can select a distance and a target time or speed and the relative positions of each effort as the benchmark effort crosses the "finish line" will be shown.
-
The activity table details section has a cleaner layout:
-
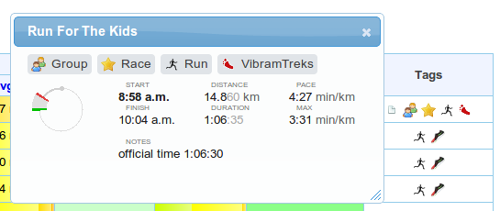
Activity notes popups have been expanded to show more details, and you can now have more than one open at a time:
-
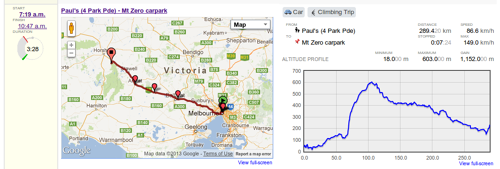
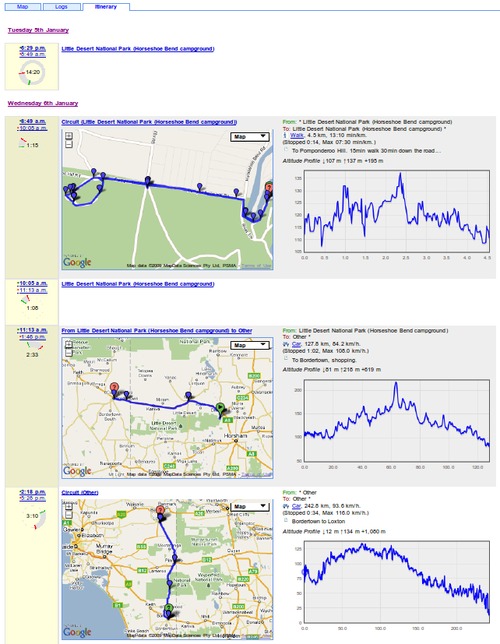
The Log File detail page has a new Itinerary tab, and the Itinerary tabs throughout the site have a nicer, cleaner layout:
-
Also, I've fixed some problems that occurred when uploading zip files with non-English file names.


