Updates for August 25th
Yet another long gap between posts, but there have been lots of updates to GPSLog Labs in the interim. Here's a brief summary:
-
Keyboard shortcuts
- f View fullscreen maps/graphs
- q Open quickfind
- escape Close full screen map/graphs and quickfind popup
The keyboard shortcuts make all these features much more useful as they're only a keypress away.
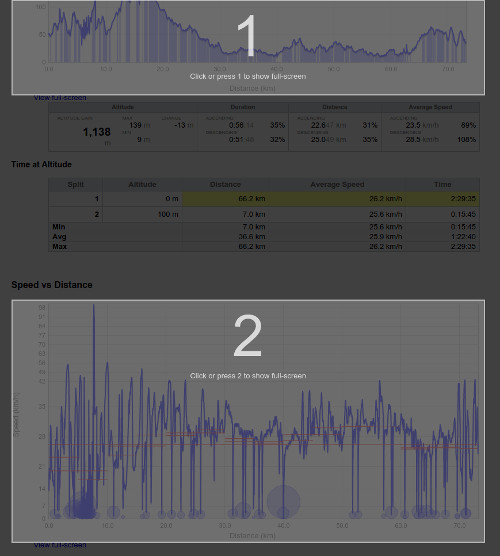
A neat feature is if there is more than one possible graph/map to view in fullscreen, an overlay is added and you can press a number to select the one you're after.
-
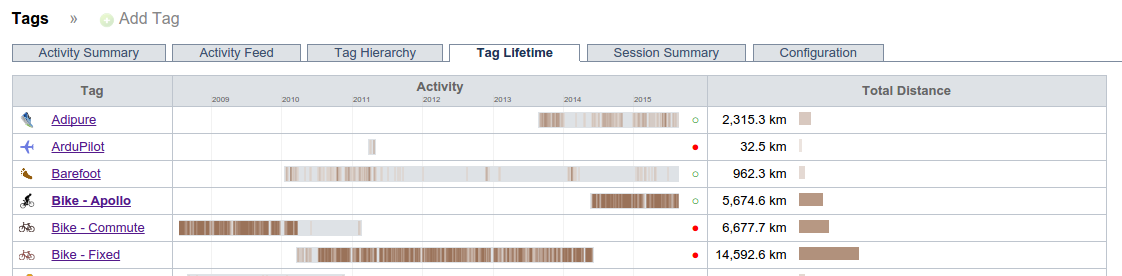
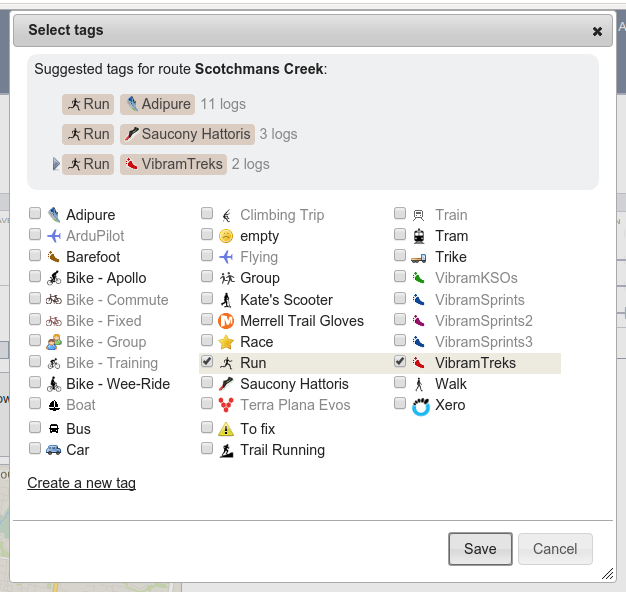
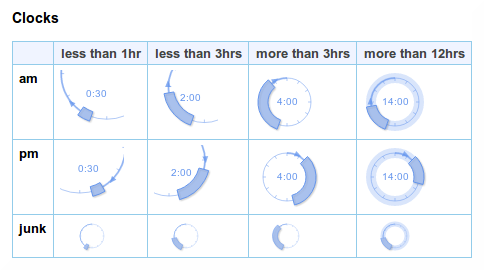
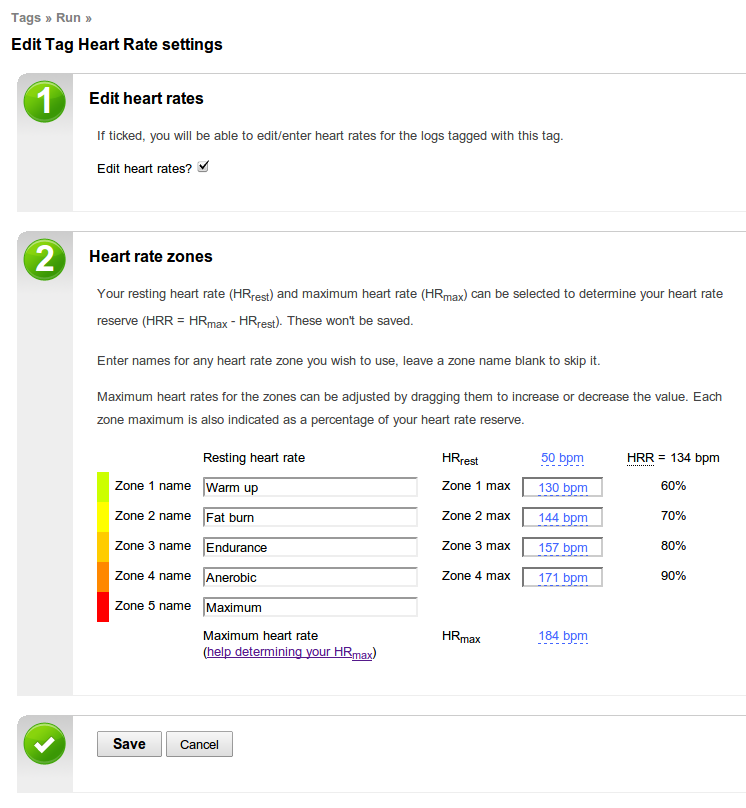
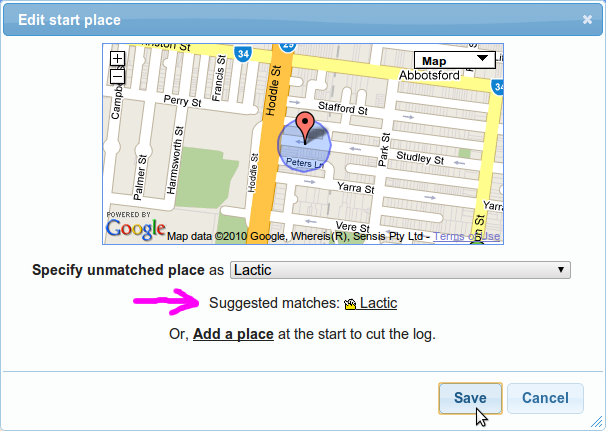
Tag, place and route lifetimes
A new visualisation attempts to indicate which tags, places and routes are still in use and those that are "retired".
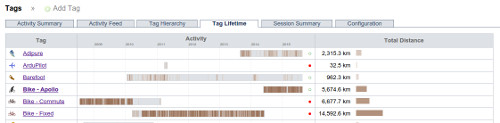
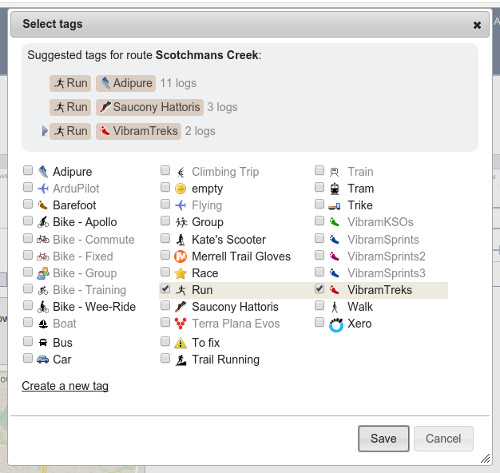
This information is also used to hide suggestions for tags and places you are probably no longer using and gray out the retired tags from the add tag popup and quick find popup.
-
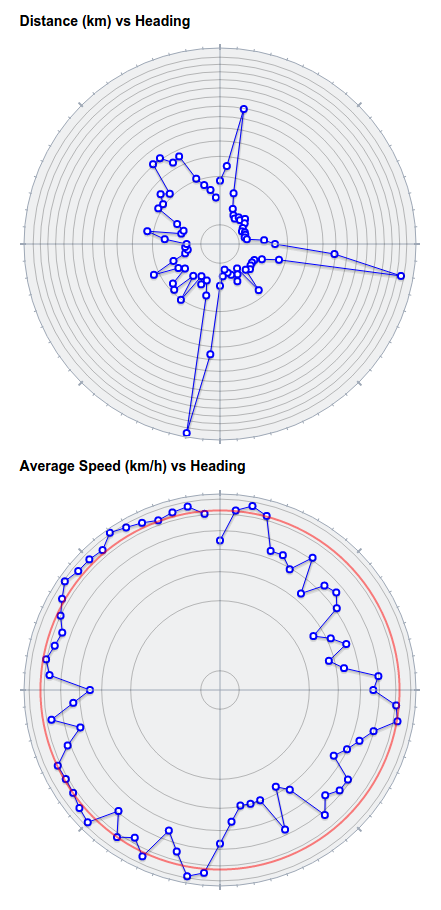
Distance and speed vs heading graphs
These graphs have been made prettier and easier to read with the graph now rendered as a circle with ticks for the compass points.
-
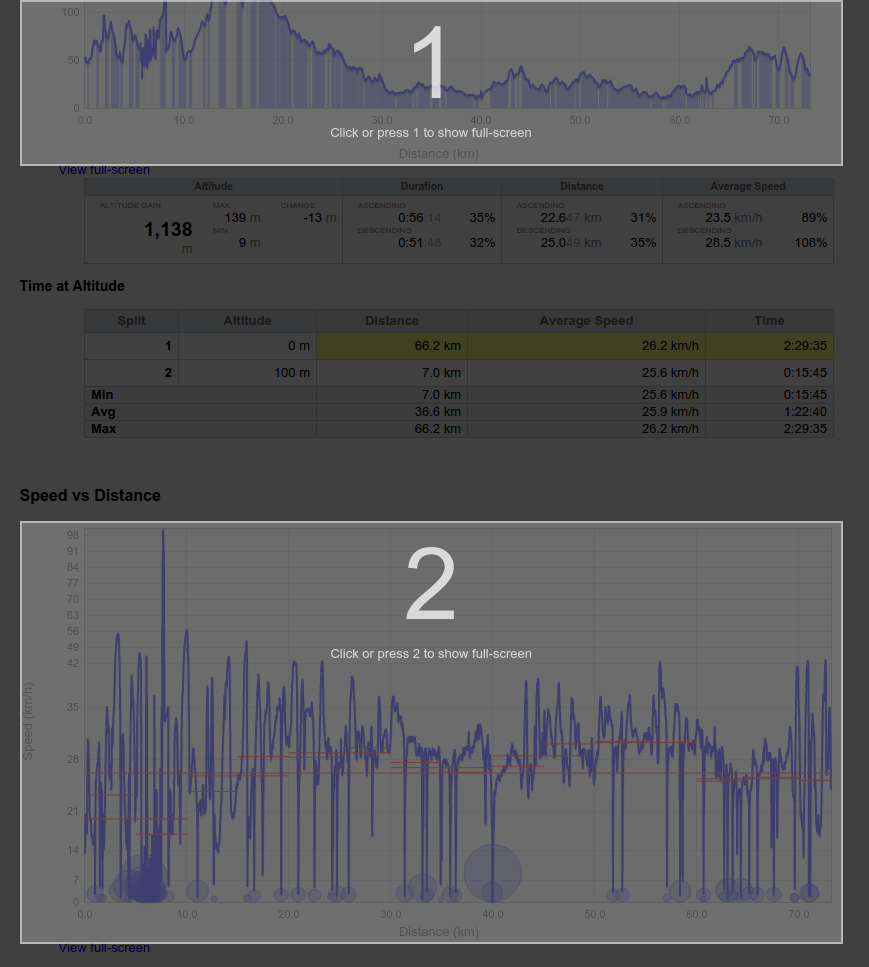
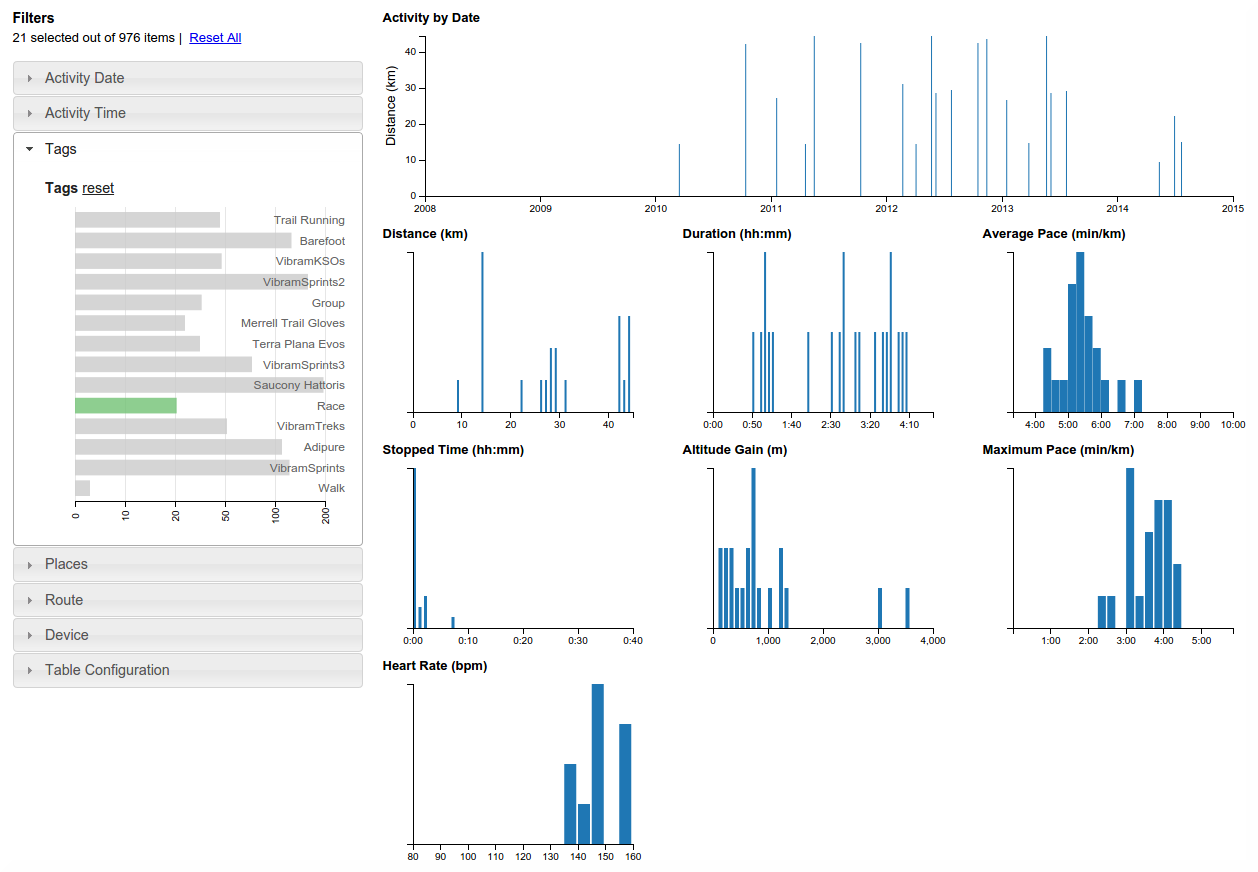
I've added axis labels to all the graphs, which will make all the grade 6 maths teachers out there happy, as well as making the graphs much easier to understand.
-
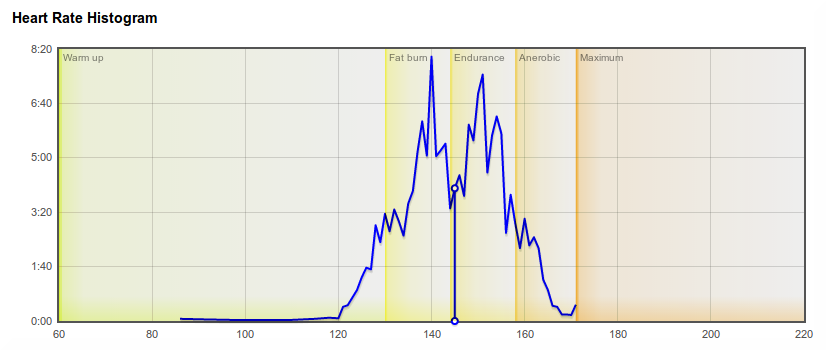
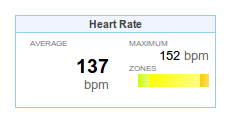
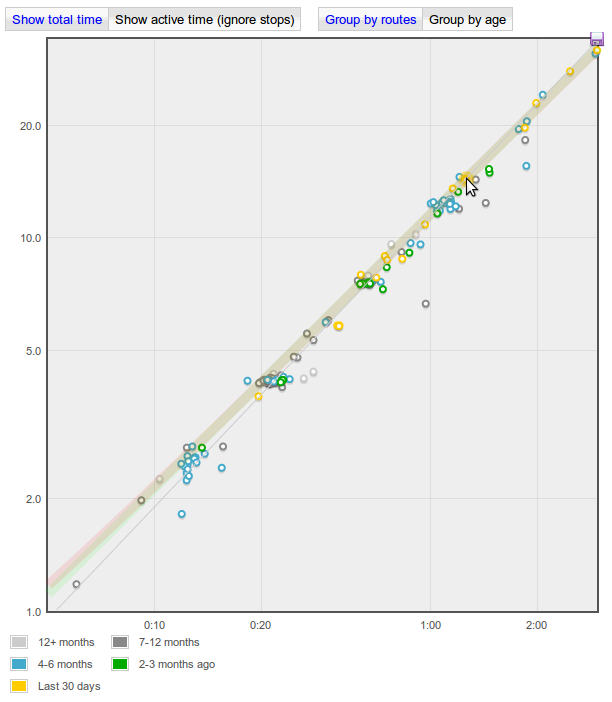
The goal, route and split detail trend graphs tabs have speed and heart rate histograms on them too now, which helps spot the trends better at a glance.
-
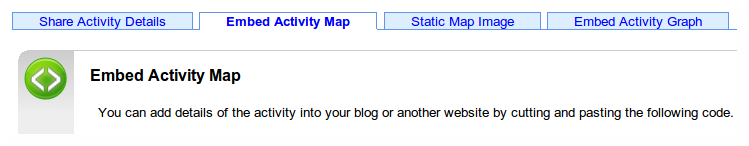
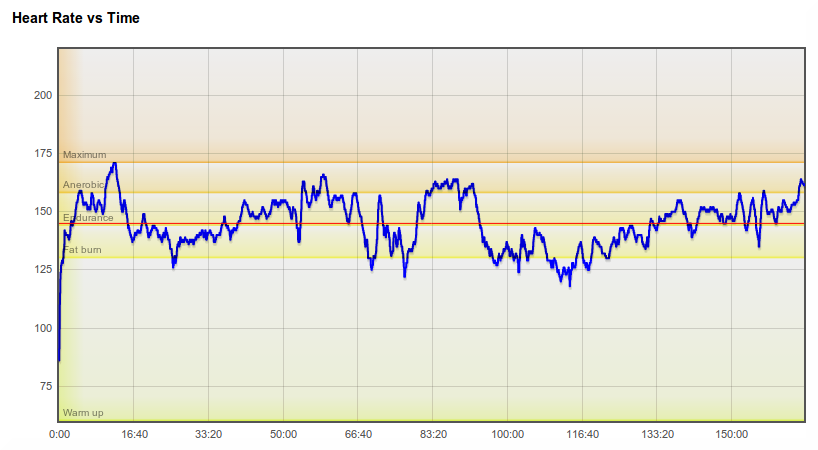
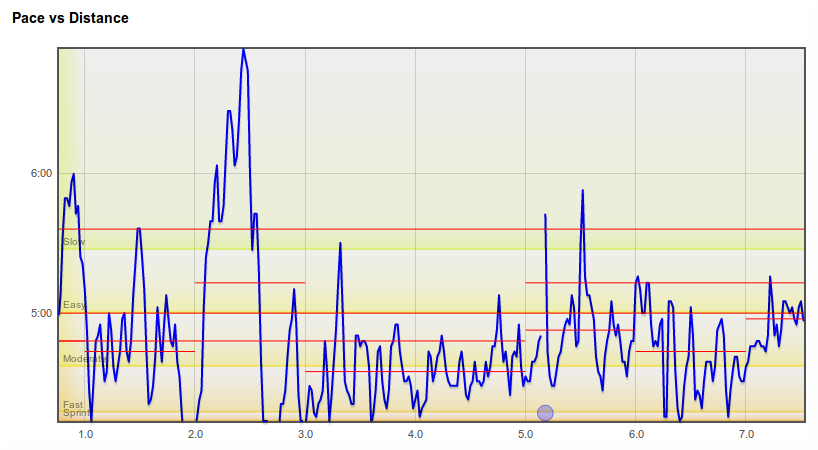
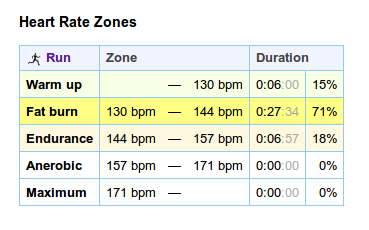
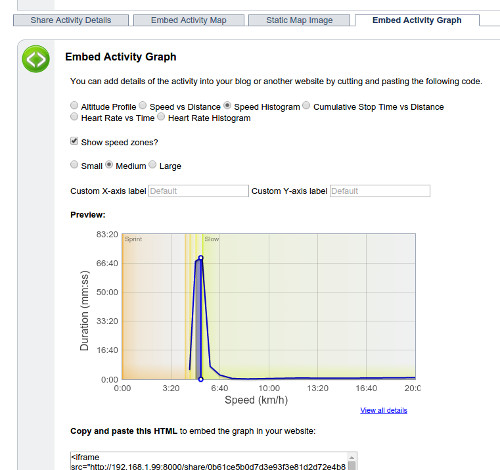
The embedded graphs you can share on your own sites now support speed and heart rate zones backgrounds as options, and also let you specify the text for the axis labels.
-
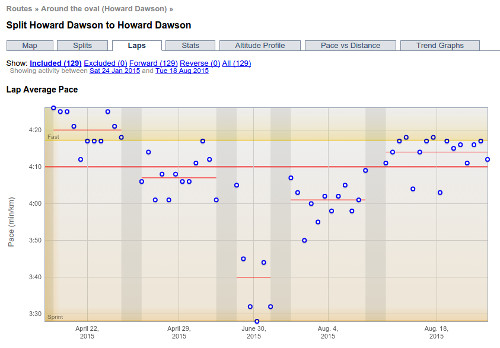
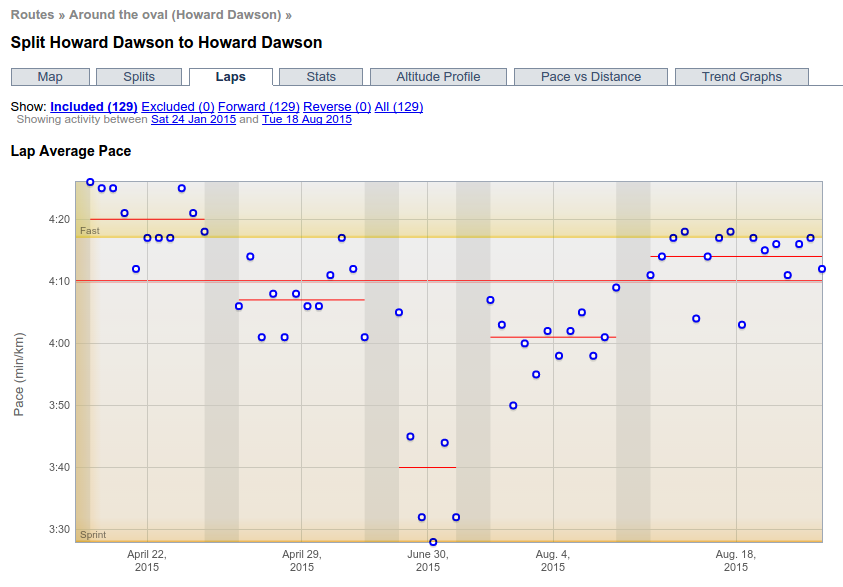
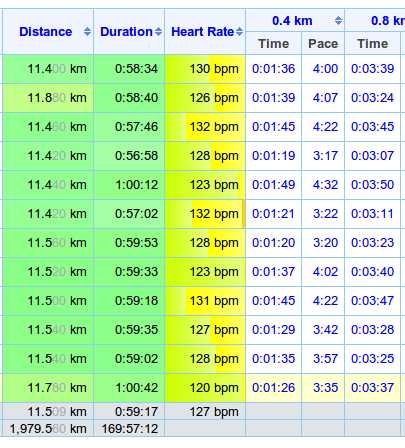
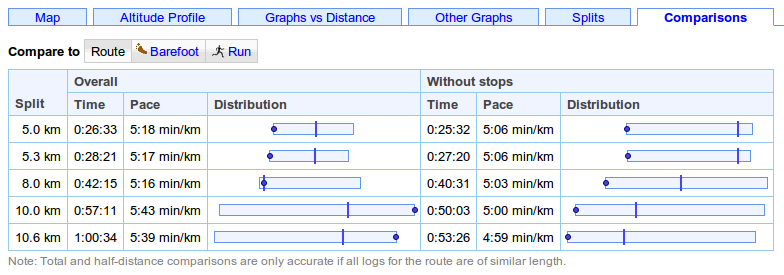
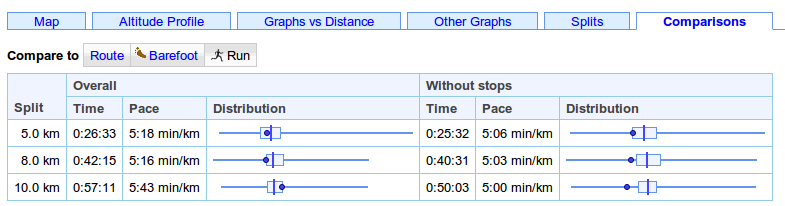
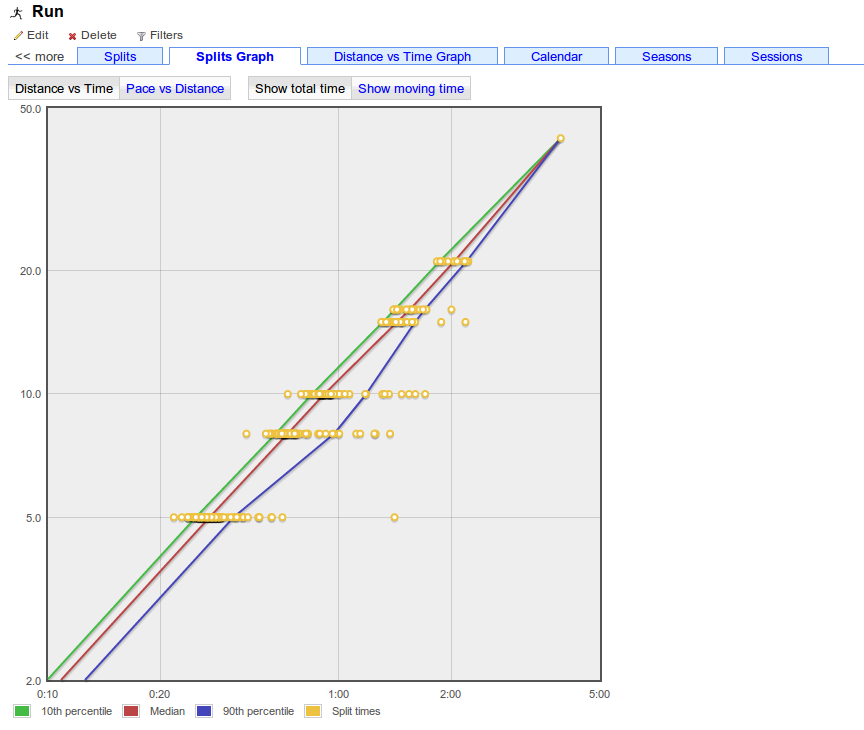
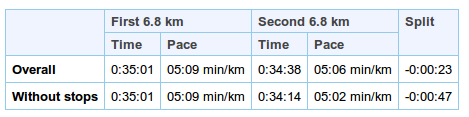
Laps graph
There's a new Laps tab on route split detail page that compares performance across sessions on activities with multiple laps, e.g. hill intervals or laps around an oval.