Routes have always been between two different places. If you wanted
to compare activity along similar routes between nearby places, you
had to create checkpoints to generate splits along the common
sections.
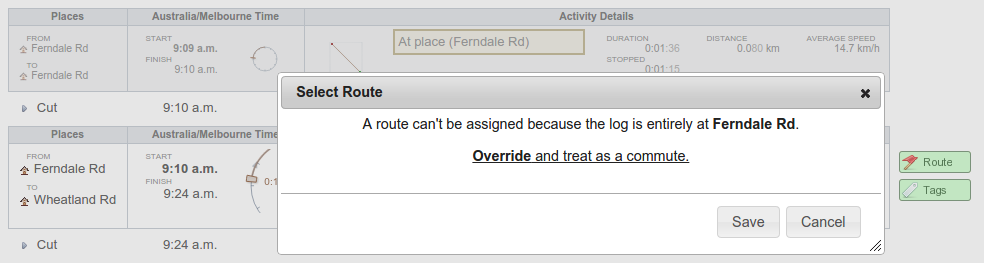
I've now changed it so that a route can start and stop at one or more
places.
This is particularly useful if you have a commute and have moved
house or jobs. It works best if the places are still fairly close
together. If they're not, then the altitude profiles, distances etc.
are not likely to be as useful, but it depends on what you are
trying to compare.
There are two ways to create these new routes:
-
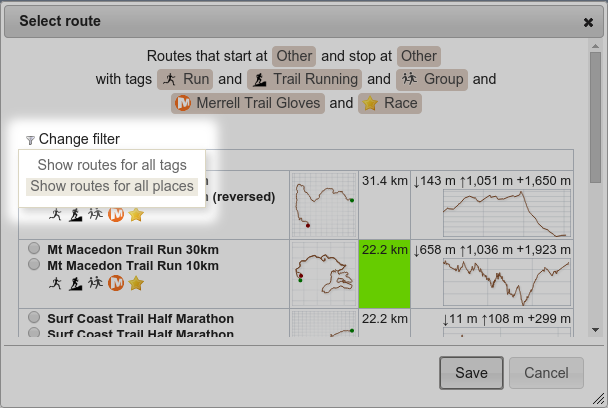
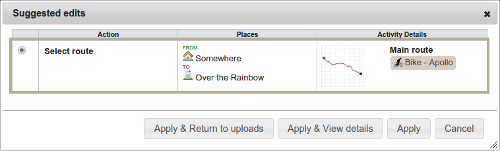
When selecting a route, choose Show routes for all
places from the Change filter dropdown.
-
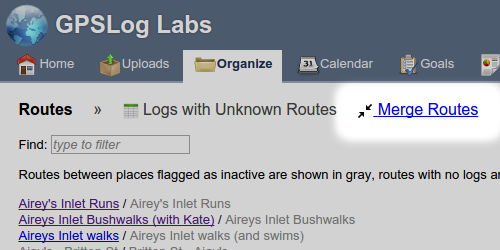
If you have had to create multiple routes already and now you
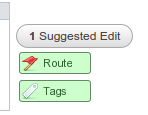
want to combine them, you can select
Merge Routes
from the Routes page:
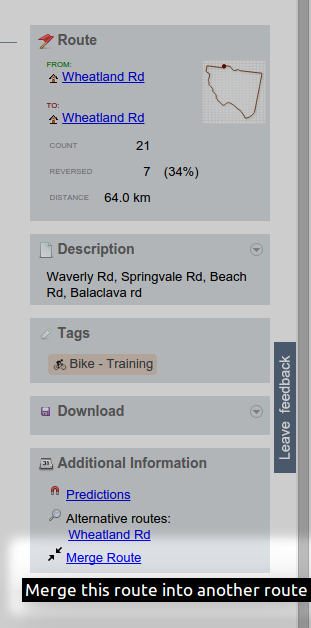
Or from the bottom of Route detail page:
That will open the Merge Routes page which allows you to select the
two routes you want to merge.
This will combine the activities and stats for the two routes.
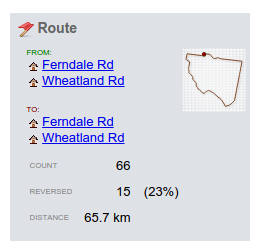
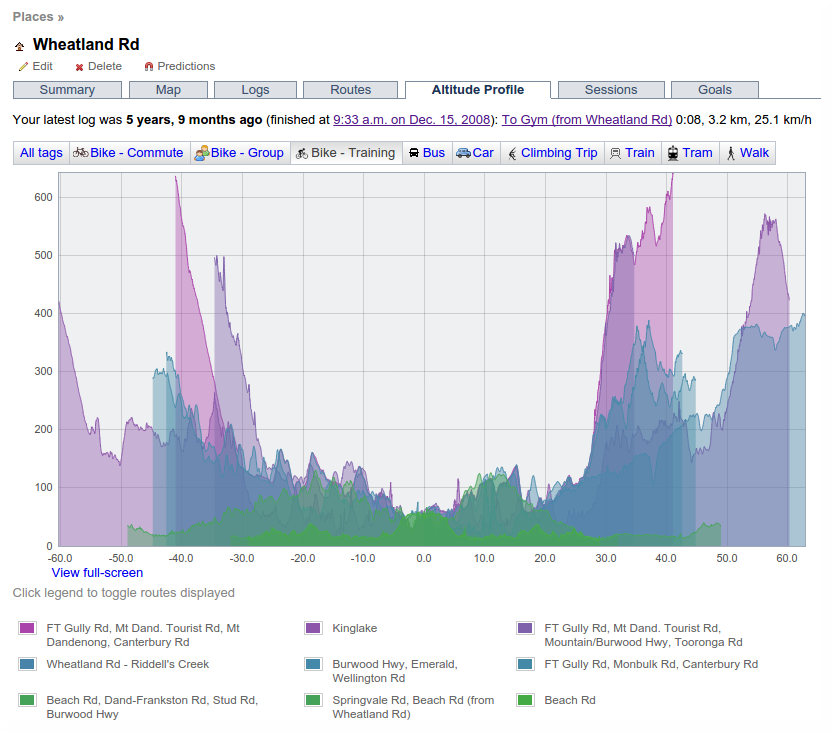
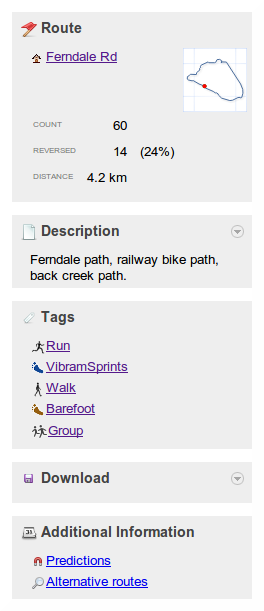
The new route detail page will list all the start and end places:
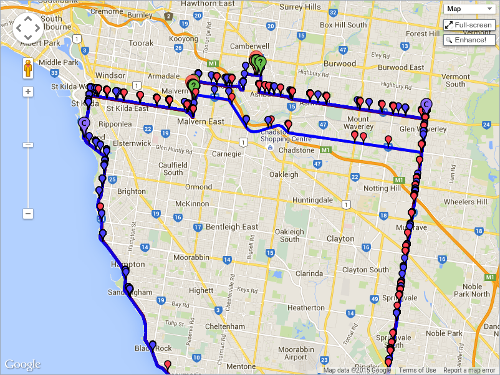
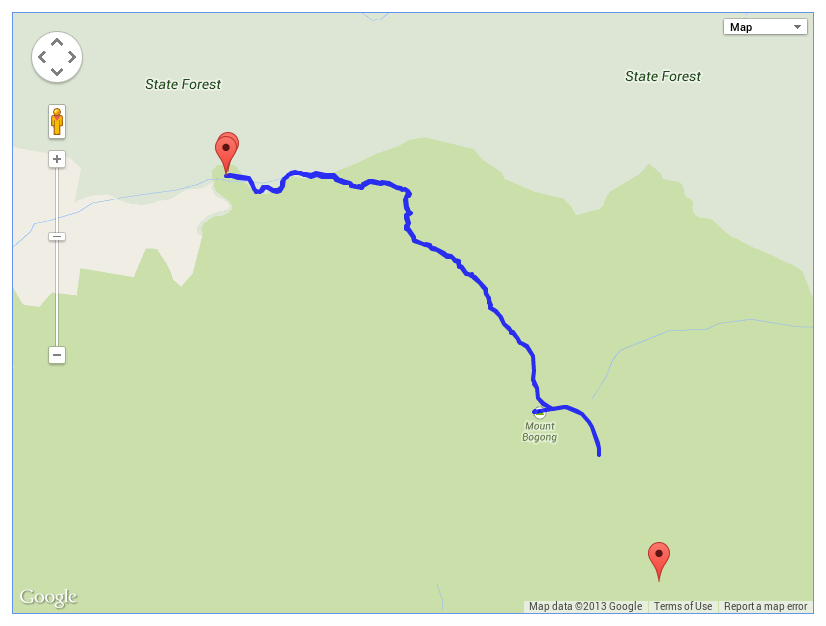
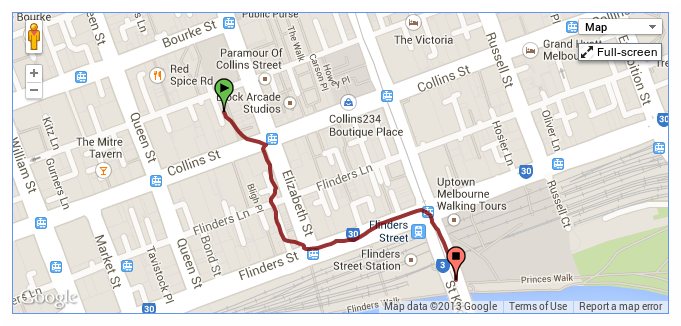
Markers for all the from/to places will be shown on the map:
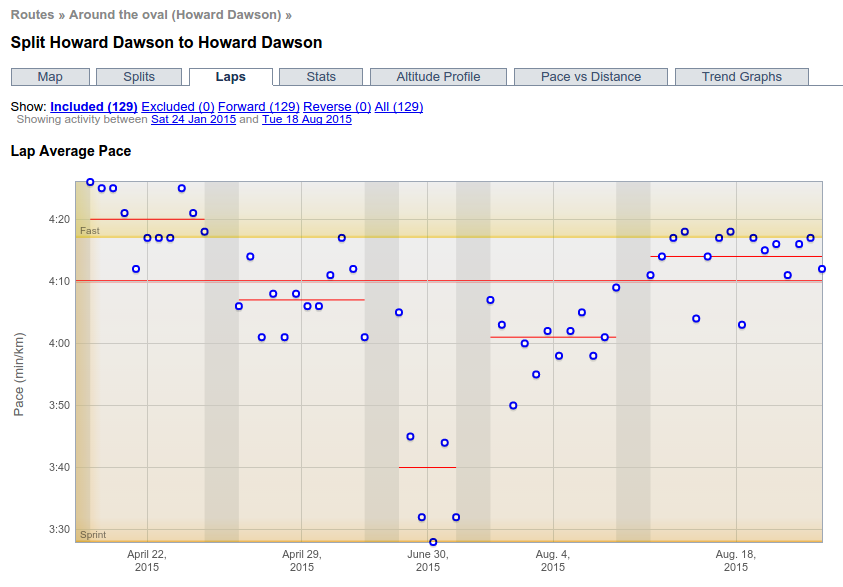
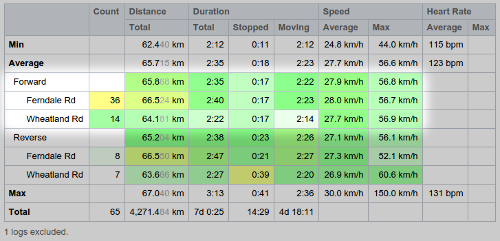
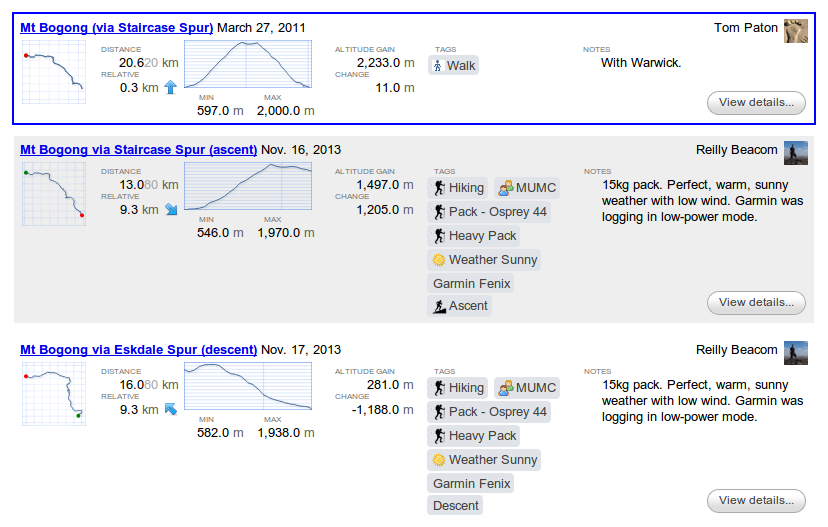
Route stats will be broken down by the pairs of start/stop places
used by the activity:
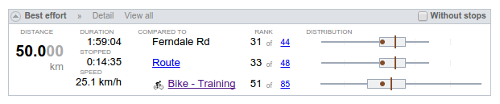
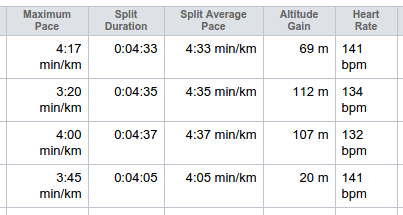
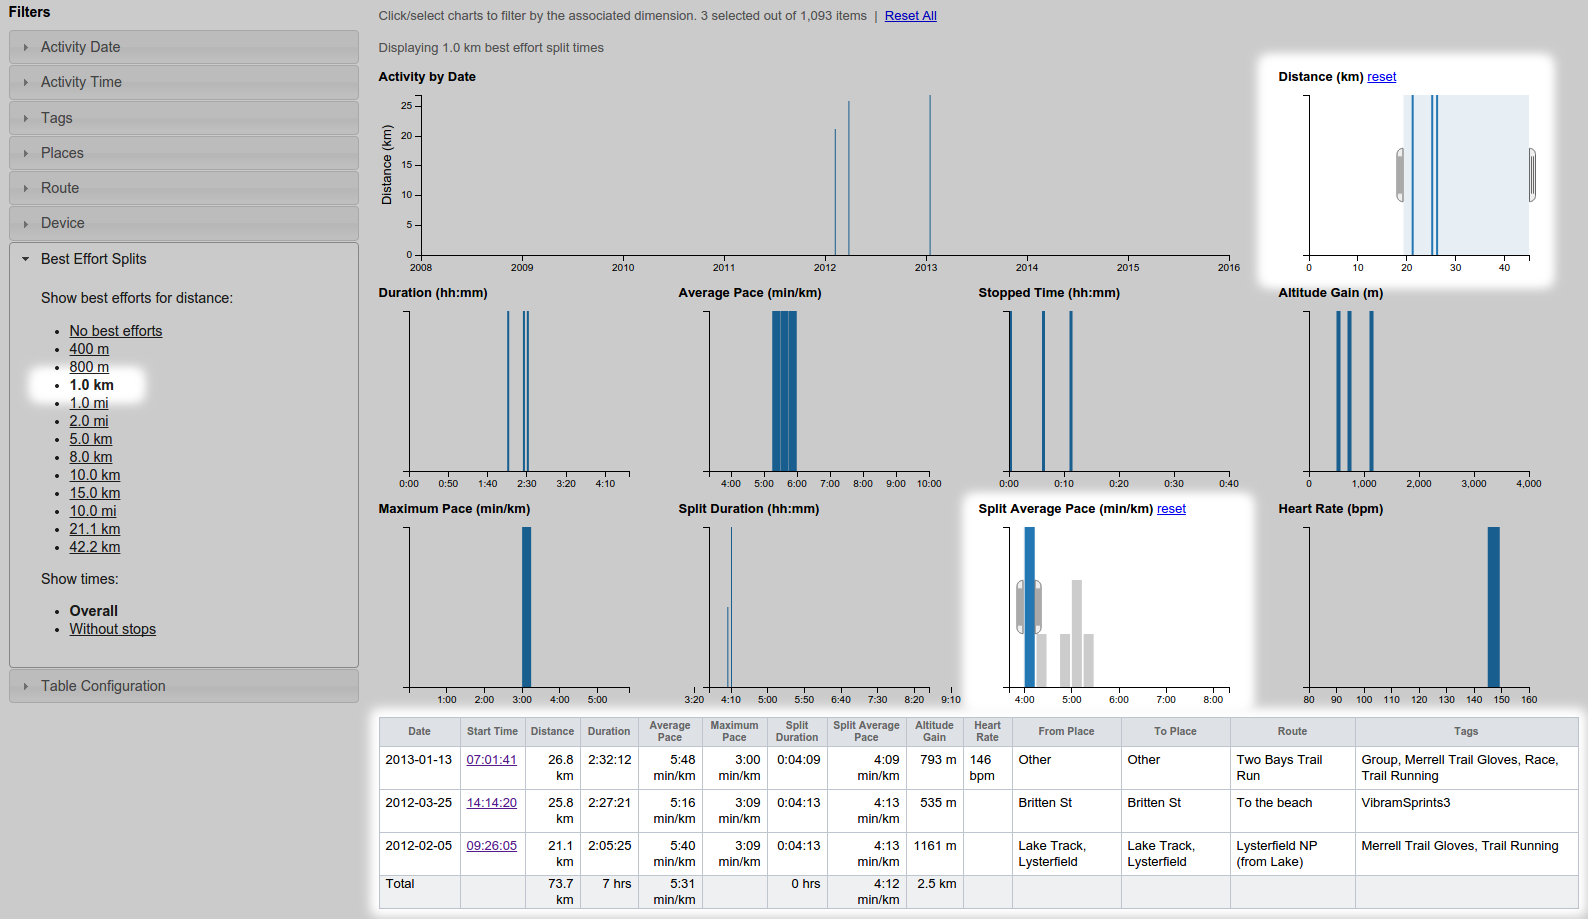
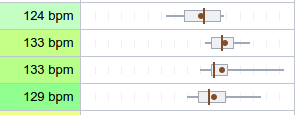
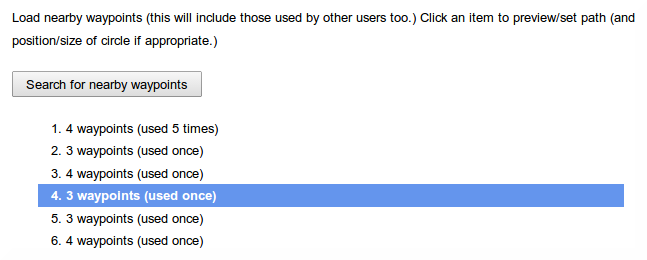
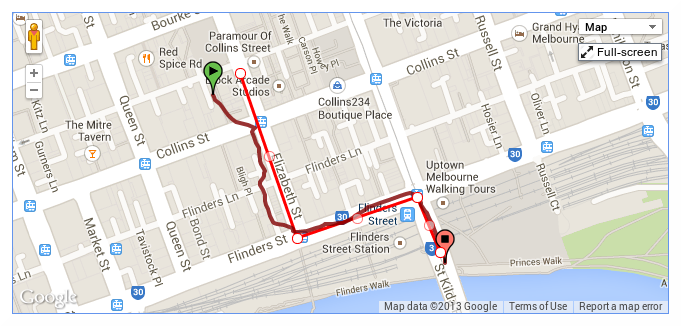
Best effort comparisons will be available for the matching
start/stop places and also all the activity in the Route:
Should you need to reverse this process, you'll need to recreate the second
route and select it for all the activity it applies to.
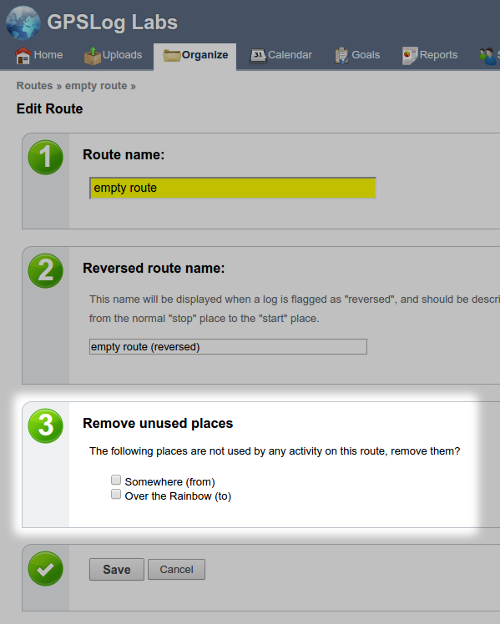
Once a start/stop place is no longer used on a route, you can remove it
from the edit route page: