GPSLog Labs Blog

GPSLog Labs Blog

New features and tips for using gpsloglabs.com

Filed under

heartrate

Updates for August 25th

Some recent (and some not so recent) updates to GPSLog Labs:

  • New clock, altitude profile and map thumbnails.

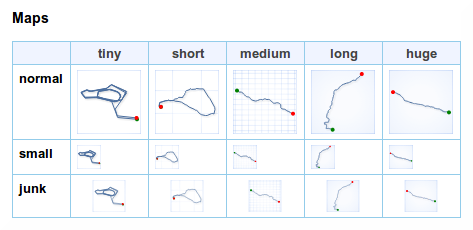
    The thumbnail images have a new updated look that is smoother and more detailed. They are also rendered in the browser, rather than being downloaded, which speeds up the display of the pages.

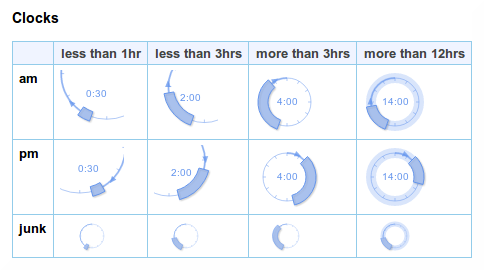
    The clocks now "zoom in" when indicating short durations to make the most of the available space and show the duration in hours and minutes too. A duration of greater than 12 hours is indicated by shading the full circle.

    An arrow indicates whether the time is a.m. or p.m. (the arrow points from the start or end time to noon).

    Times for "junk" activity are shown in a small and simplified thumbnail.

    Altitude thumbnails simply show the profile, with distance grid lines every 10km and altitude grid lines every 100m.

    Map thumbnails have a 1km grid to indicate scale, and show the start location as a green dot and the end location as a red dot.

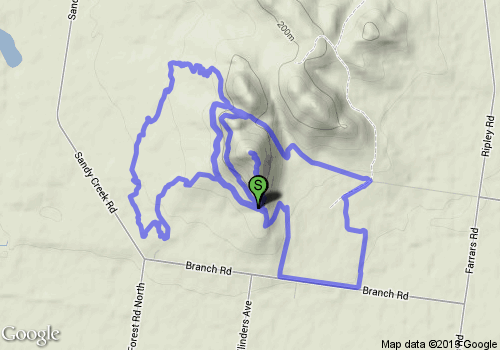
  • You can now generate a Google "static map image url" for an activity via the Activity detail "Share Log" page. I.e. a simple image file that can be downloaded or added to a page and it doesn't require any scripting to make it work.

    This feature is only available for shared activity, but once the url has been generated or the image downloaded, the activity can be made private again.

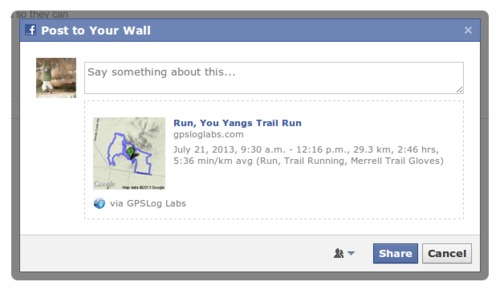
  • The thumbnail for activity you share to your Facebook timeline is now a small "terrain" map. This looks nicer and has more detail than the old icon.

  • Activity tags are now sorted by overall frequency, not just alphabetically. This makes the titles of pages (particularly shared activity and posts to Facebook etc.) more sensible as the primary activity tag is likely to be first (e.g. "Bike" or "Run") followed by any minor tags (e.g. shoe type or bike being used).

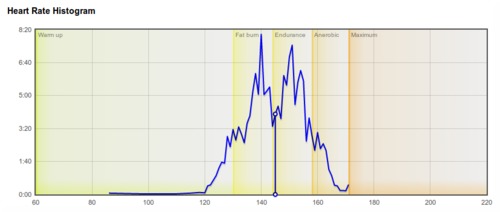
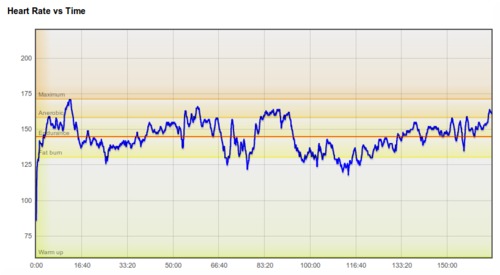
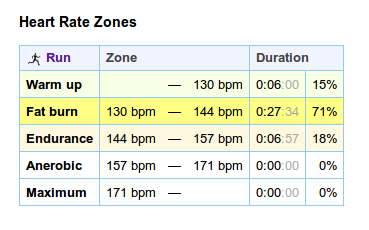
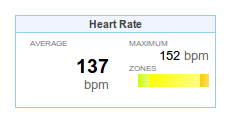
  • I've added shading on activity heart rate graphs to indicate hear rate zones:

    An earlier post has details on setting up heart rate zones for your tags.

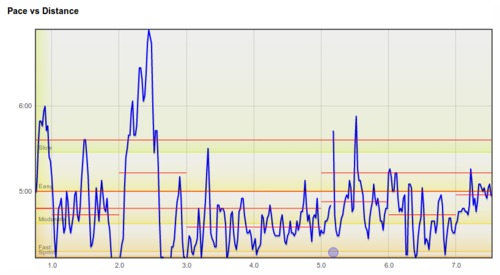
  • Likewise, there is also shading on activity speed graphs to indicate speed zones if you have them configured.

    There are links under these graphs to take you to the zone configuration if you haven't yet set up speed zones (or heart rate zones).

  • A bug that meant times weren't working properly for non-English dates on the manually create segments page has been fixed. Note, this page still won't work properly for very long files/segments. It's probably best that those are edited using gpsbabel before uploading to GPSLog Labs.

    This page has also been updated with the new layout.
Filed under  //  changelog   graphs   maps   filters   editing   facebook   sharing   thumbnails   time filter   tags   heartrate  

Updates for January 7th

I've made a few more changes to GPSLog Labs to better support heart rate logging:

  • Heart rate data can now be filtered!

    These filters work in the same way as the other GPS data filters and can be added to individual logs or to tags so they are added automatically.

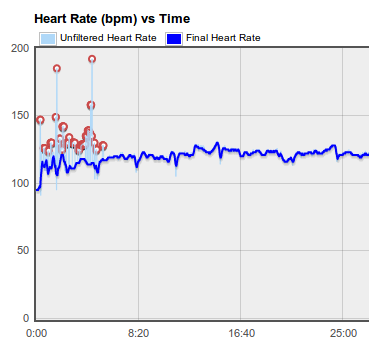
    There are 3 heart rate filters, one takes the median heart rate, one the average (mean) heart rate and the last one is a special filter to clean up noisy heart rate data during your warm-up where the heart rate strap doesn't record properly until you've built up a bit of a sweat.

    Gpsloglabs_-_gps_data_filters

    You put in a "warm up time" (7 minutes in the above image) and it will discard any readings that are too high during that period. It assumes your heart rate after you've warmed up is higher than when you're warming up which is pretty rough, but it cleans up a lot of messy data.

  • Additional heart rate log files can be uploaded in .zip files
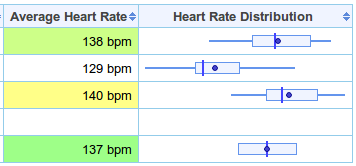
  • The tag detail page summary tab now has "box whisker" plots for the heart rate distributions
    Gpsloglabs_-_run_summary

Some other recent changes include:

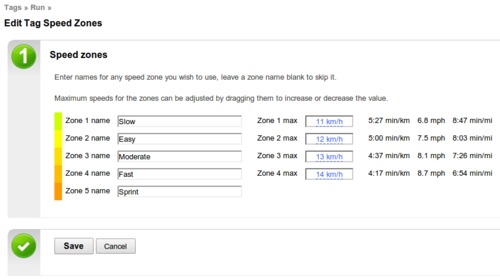
  • Speed zones
    Gpsloglabs_-_run_zones

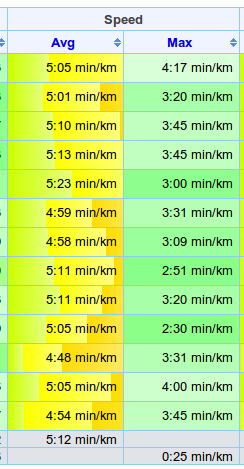
    These are configured per tag like heart rate training zones and will be displayed in the background of the activity tables to give you an indication of the intensity of the activity.

  • The Speed Average filter has been changed from an exponential average to a regular mean, so it no longer "lags" behind the signal.
  • The Speed Median and Speed Average filters have also had a cutoff added to preserve stops, any data below that threshold won't be filtered.
  • The GPSLog Labs home page has a new layout that highlights some key features a little more prominently.
  • Alert & confirm popups use the alertify.js library.
  • Support for the Garmin FIT file format has been added.
Filed under  //  changelog   filters   heartrate  

Heart rate graphs

The heart rate analysis features of GPSLog Labs have had some big updates:

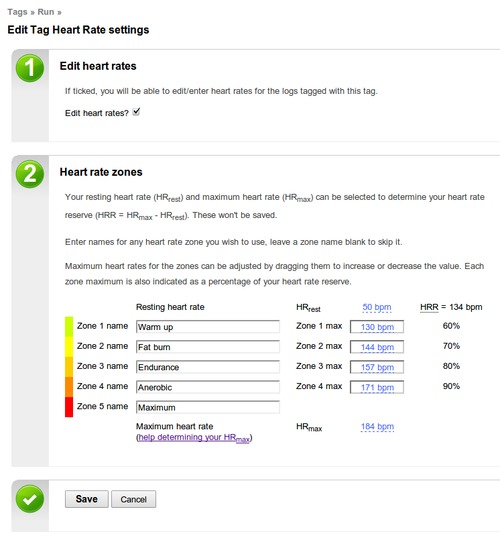
Firstly, you can now set up heart rate training zones for each tag.

Each zone can have a name and an upper heart rate, to assist configuring the zones, you can set your resting and maximum heart rates and the percentage of your heart rate reserve (maximum - rest) for each zone is displayed.

Once these are set up, you can see breakdowns of the time in each zone on the activity detail heart rate tab:

Screenshot-log_hr_zones_table
Screenshot-log_hr_zones_detail

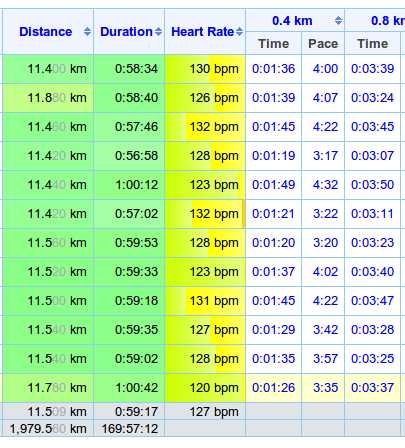
And best of all, on the activity tables for a log or route, the proportions of time in each heart rate zone are shown as colours in the background of the table cell:

Screenshot-hr_zones_table_bg

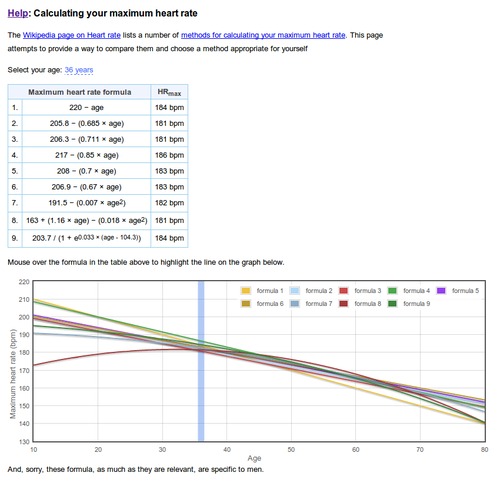
To assist in calculating your heart rate zones, I've also created a maximum heart rate calculator page. This page is accessible without a GPSLog Labs account and might help you wade through the mass of different formulas for calculating a maximum heart rate that are out there (or at least the ones on the Wikipedia page.)

It's been possible for a while now to upload additional heart rate data for an activity. This allows you to use a stand-alone heart rate logger (such as a Polar HRM) if your GPS logger doesn't record heart rate directly.

The upload process has been made more flexible, it now imports data from more formats (such as GPX and Garmin Training Centre TCX) and will automatically detect the format.

The uploaded heart rate files are now stored together with the log files and will be automatically reapplied after processing or editing filters.

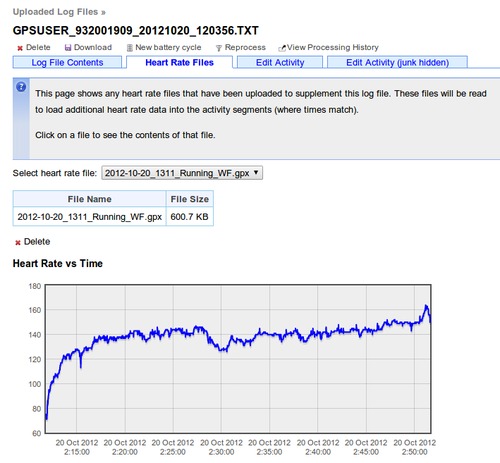
There's a new tab on the uploaded log file page where the heart rate data can be previewed and downloaded or removed too if necessary.

Heart rate data can also be uploaded for manual entries, for example for data logged on a treadmill or wind-trainer.

Filed under  //  changelog   graphs   heartrate   tags  

Updates for September 2nd

  • Support for the Nav N Go iGO 8 track format has been added. This looks like a pretty good app, but has a terrible name, not that I can talk...
  • Behind the scenes there's a new storage engine which will be able to handle a lot more growth in uploads. Let me know if you notice anything odd.
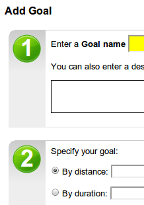
  • There's a new "smoother" design on the forms throughout the site:
    Screenshot-new-wizardstep-desi
  • The goal detail page now has a map tab.
  • The activity "Comparisons" tab has a new statistic: The split for the first and second halves of the activity. The theory is that if you've paced yourself properly and haven't slowed as you got tired this should be 0 or even negative.
    Screenshot-negative-split
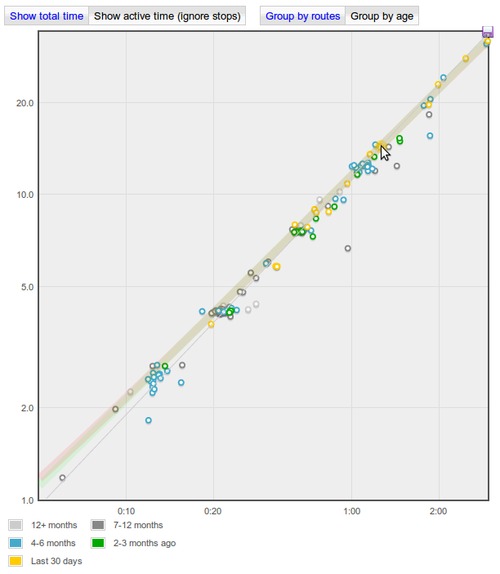
  • The Distance vs Time graphs on the tag detail and goal detail pages now have options to show the logs group by route (the default, and previous behaviour) or by "age". This will let you see how your performance has changed over time:
  • And, finally, it's now possible to upload a heart rate data file from a separate heart rate logger and have it stored together with the appropriate activity.

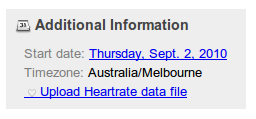
    On the activity detail page, there's a little link in the right hand side panel to "Upload Heart rate data file":

    Screenshot-upload-hr-link

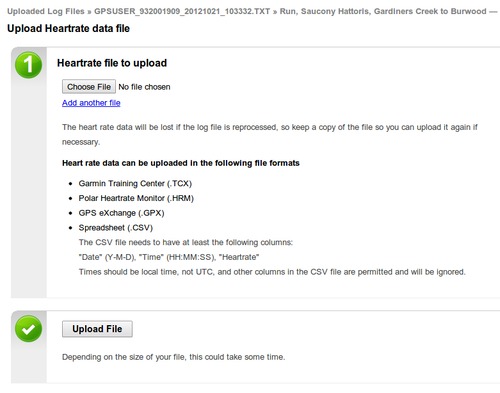
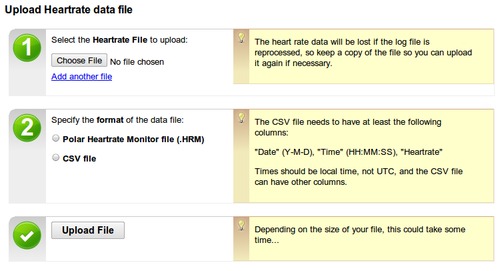
    Clicking that will give you a form where you can upload one or more heart rate log files in either Polar HRM or CSV formats:

    The original files aren't stored on the GPSLog Labs server though, so if you reprocess the log file (add a place, merge segments etc.) then you'll have to re-upload them.

Note that if you have enabled editing of heart rates for a tag, then the "Upload heart rate data file" link will be found on the Heart Rate tab of the activity detail page.

Filed under  //  changelog   graphs   heartrate   igo8   stats   upload  

Heart rate logging

Support for heart rate logging in GPSLog Labs has been added for Garmin devices that use the Garmin Training Center format (i.e. .TCX files).

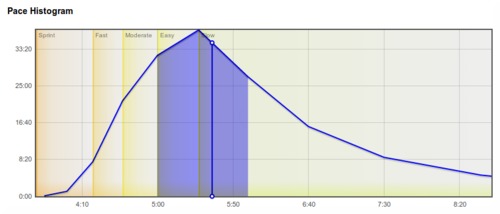
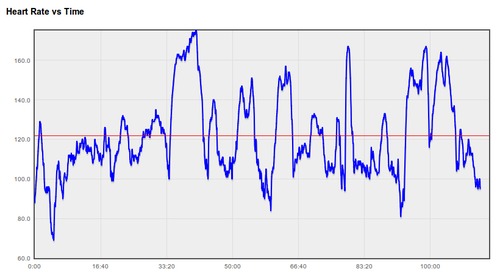
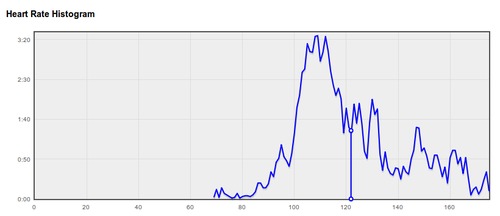
You can see graphs of your Heart Rate vs Time and a histogram of your heart rate on the activity detail page:

Heart rates will be repeated to fill in gaps if the readings occur less than once per second, up to a maximum of 5 minutes.

If you have a device that logs heart rates, and the graphs aren't showing up in GPSLog Labs, please let me know and I'll add support for it.

Note that this will only work for logs out doors where a latitude and longitude is recorded with the heart rate, so if you're using something like a Garmin EDGE705 in indoor mode, you won't be able to view your activity or heart rates.

If you don't have a GPS logger that records your heart rate at each point, you can still record average and maximum heart rates against your activity manually (i.e. based on a non-logging heart rate monitor strap.)

To switch heart rates on manually:

  1. Go to tags, and select a tag you want to record heart rates for (e.g. Running or Bike)
  2. Edit the tag, click the "Edit heart rates" checkbox.
  3. Now, when you go to activity tagged with that tag, you'll see the "heart rate" tab (this usually only shows up if your logger supports heart rates.)
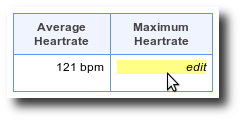
  4. On that tab, the average and maximum heart rate values will show "edit", click that, type in the heart rate and click the save button.
    Heart_manual_1

Once the system has heart rates recorded against your activity (either automatically or entered manually) they will show up in summary and comparison tables and graphs for routes and tags.

Filed under  //  changelog   devices   graphs   heartrate  

© 2013 Tom Paton | GPSLogLabs.com | Source | Feedback | RSS | Subscribe