GPSLog Labs Blog

GPSLog Labs Blog

New features and tips for using gpsloglabs.com

Filed under

time filter

Updates for November 10th

Some recent updates to GPSLog Labs:

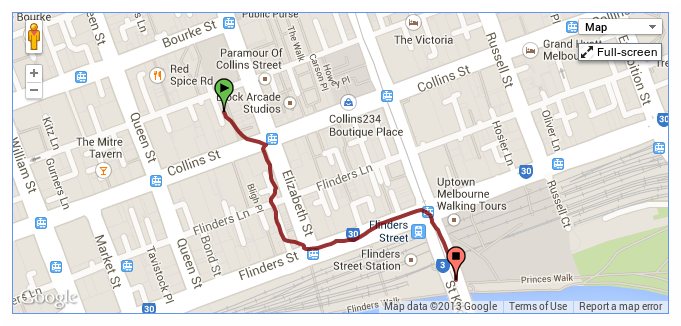
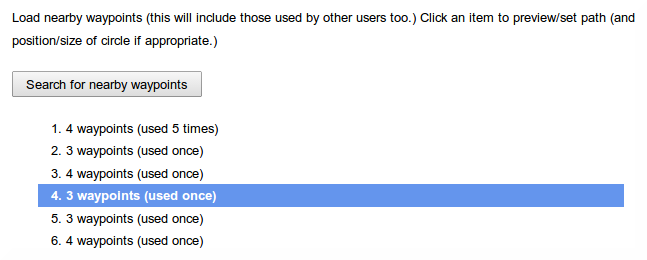
  • When filtering a log file using a time or position filter, you can now copy nearby waypoints, rather than drawing the line each time.

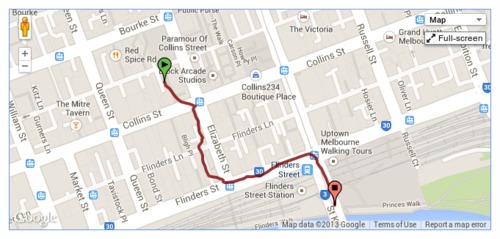
    Once you zoom into/select the area to be filtered, click the "Search for nearby waypoints" button.

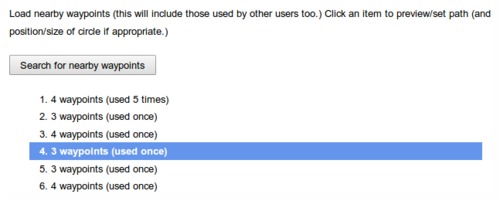
    This will list all the nearby waypoints and you can click on them to copy them into your filter.

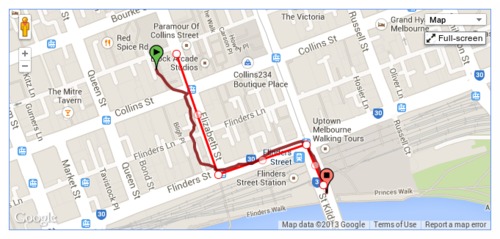
    This search uses not only waypoints you've created before, but also those created by all the other GPSLog Labs users, so you can take advantage of paths others have marked and save yourself some effort.

  • New forward vs reverse performance chart for routes.

    This graph compares the forward speed with the reverse speed for any days where you go in both directions on the route. E.g. a commute to and from work.

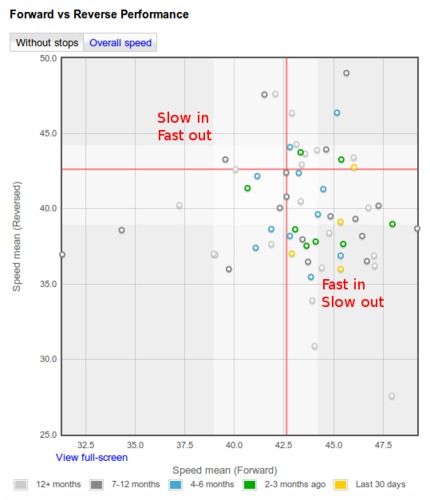
    The shading on the graph represents the 25th—75th percentile of the data, the red line indicates the median speed.

    Points in the bottom-right represent fast forward direction with a slow log in the reverse direction, while the points in the top-left are slow forward and fast reverse. (Note, this description is flipped for pace formats.)

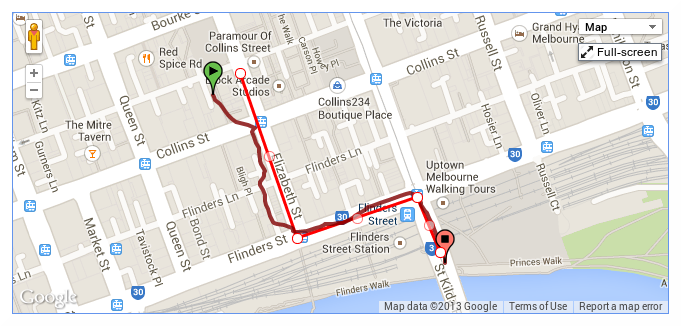
  • Download places as waypoints in a GPX file that you can load into your GPS to assist with navigation and route planning.

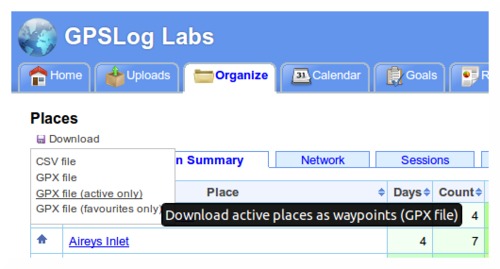
    The Places page has a new "Download" menu that lets you generate a GPX file containing waypoints for each of the places you have created.

    You can choose to get all your places, just the active places or just your favourites.

    This menu also incorporates the CSV download option which will get all your place information into a spreadsheet.

  • Downloaded zip files now have modified dates of the files set to the current date/time.

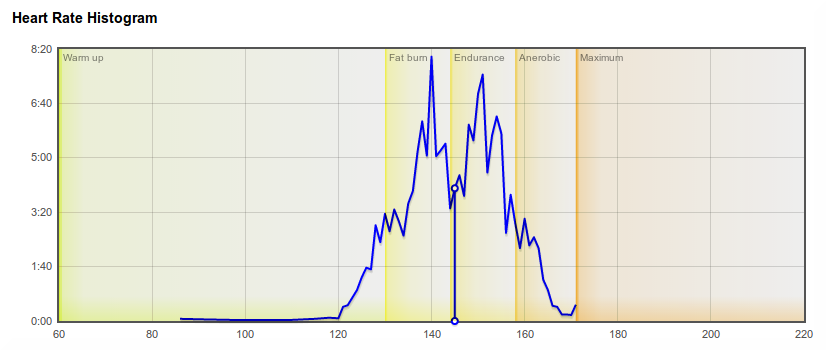
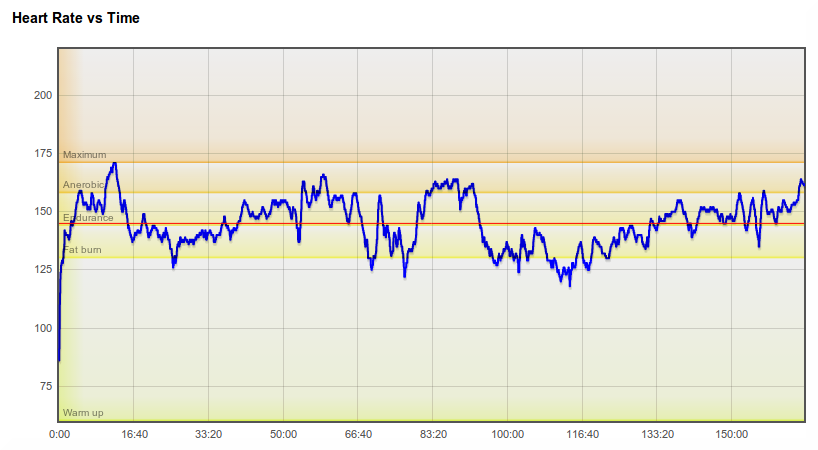
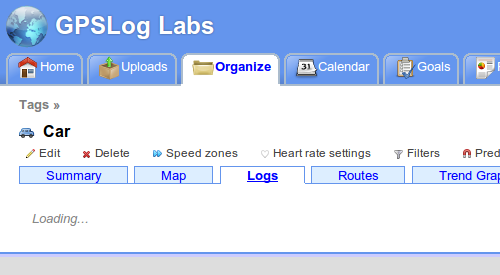
  • The tabs on various pages around the site now load dynamically, so you'll notice a little "Loading..." message after the tab is clicked. You can then quickly switch between the tabs without waiting for the whole page to load again. This is very handy when comparing the heart rate graph with the altitude profile or speed graphs, for example.

  • And lastly, a little tip:

    Set a place radius to 1m to prevent it being used to cut activity without having to mark it as inactive. This will still allow you to select the place as a start/end point manually.

    This can be handy if you pass by a place on a regular commute and don't want to have to remove the stop from your processed activity.

Filed under  //  changelog   routes   filters   position filter   time filter   places   waypoints   tips  

Updates for August 25th

Some recent (and some not so recent) updates to GPSLog Labs:

  • New clock, altitude profile and map thumbnails.

    The thumbnail images have a new updated look that is smoother and more detailed. They are also rendered in the browser, rather than being downloaded, which speeds up the display of the pages.

    The clocks now "zoom in" when indicating short durations to make the most of the available space and show the duration in hours and minutes too. A duration of greater than 12 hours is indicated by shading the full circle.

    An arrow indicates whether the time is a.m. or p.m. (the arrow points from the start or end time to noon).

    Times for "junk" activity are shown in a small and simplified thumbnail.

    Altitude thumbnails simply show the profile, with distance grid lines every 10km and altitude grid lines every 100m.

    Map thumbnails have a 1km grid to indicate scale, and show the start location as a green dot and the end location as a red dot.

  • You can now generate a Google "static map image url" for an activity via the Activity detail "Share Log" page. I.e. a simple image file that can be downloaded or added to a page and it doesn't require any scripting to make it work.

    This feature is only available for shared activity, but once the url has been generated or the image downloaded, the activity can be made private again.

  • The thumbnail for activity you share to your Facebook timeline is now a small "terrain" map. This looks nicer and has more detail than the old icon.

  • Activity tags are now sorted by overall frequency, not just alphabetically. This makes the titles of pages (particularly shared activity and posts to Facebook etc.) more sensible as the primary activity tag is likely to be first (e.g. "Bike" or "Run") followed by any minor tags (e.g. shoe type or bike being used).

  • I've added shading on activity heart rate graphs to indicate hear rate zones:

    An earlier post has details on setting up heart rate zones for your tags.

  • Likewise, there is also shading on activity speed graphs to indicate speed zones if you have them configured.

    There are links under these graphs to take you to the zone configuration if you haven't yet set up speed zones (or heart rate zones).

  • A bug that meant times weren't working properly for non-English dates on the manually create segments page has been fixed. Note, this page still won't work properly for very long files/segments. It's probably best that those are edited using gpsbabel before uploading to GPSLog Labs.

    This page has also been updated with the new layout.

Filed under  //  changelog   graphs   maps   filters   editing   facebook   sharing   thumbnails   time filter   tags   heartrate  

New "Splat" filter

A problem you'll encounter very quickly when using a GPS logger is "splats" in your log files caused by a bad signal while you're inside a building or other area with lots of signal reflections.

This can be very annoying as it will often create spikes in your speed that completely mess up any maximum speed or distance statistics for that log file.

For a while, GPSLog Labs has had "position" and "time" filters that let you manually remove these "splats" but it was tedious to get right, so now a simpler "splat filter" has been added that makes the process much less painful.

First, go to the activity you want to filter and click on the Filters link in the side panel:

Screenshot-splat-filter-before

Then click "Add a filter" and choose "Splat filter":

On the Splat filter page, you need to drag the marker so that it covers the "door" of the building. It doesn't have to cover all of the spikes of the splat, you just need to capture the last good point before you enter the building and the first good point when you get out and start getting a good signal again.

As you can see, the marker is only covering the actual building under the splat, not the whole splat.

The Splat filter will then discard all the points while you were inside the building and interpolate over the gap (which will give you a long period of very slow or 0 speed, restoring the stats of your log back to something sane):

The results are dramatically better, the distance and maximum speed are both now much more accurate and representative. This log also included the Static Navigation filter as the AMOD AGL 3080 logger was quite bad for logging at walking speeds.

Enjoy!

Filed under  //  changelog   discard filters   filters   position filter   splat filter   time filter  

© 2013 Tom Paton | GPSLogLabs.com | Source | Feedback | RSS | Subscribe