GPSLog Labs Blog

GPSLog Labs Blog

New features and tips for using gpsloglabs.com

Filed under

goals

Updates for June 26th

This is a quick summary of the recent updates to GPSLog Labs:

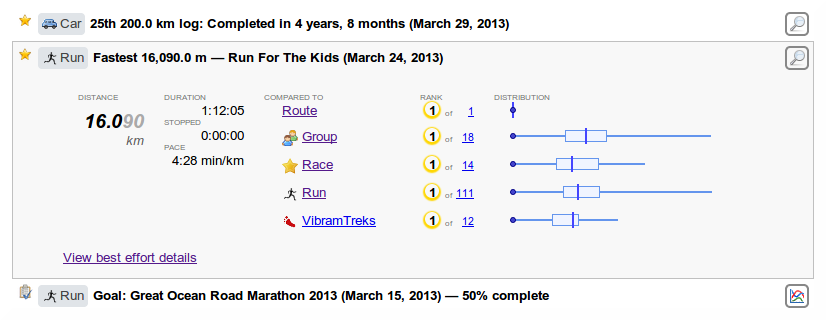
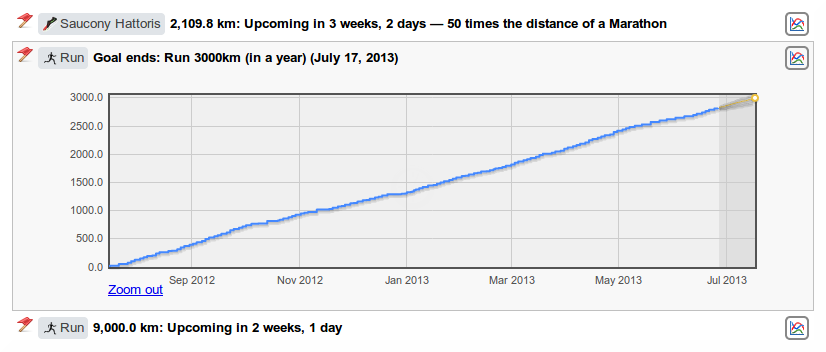
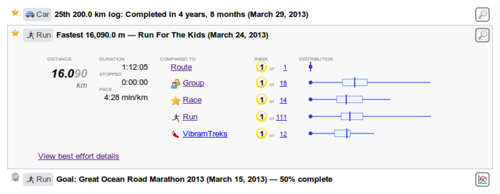
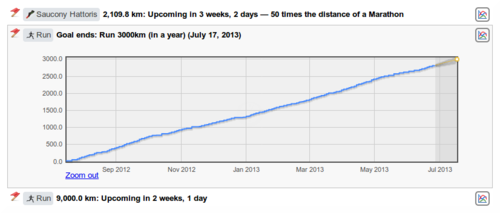
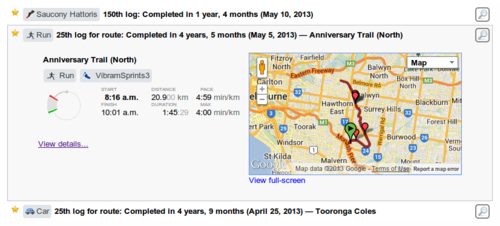
  • The new "Activity feed" has had some extra elements added to help you be aware of recent and upcoming significant achievements:

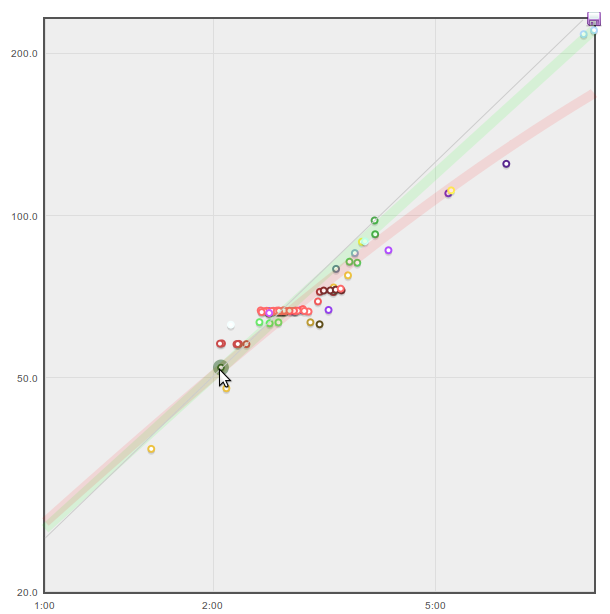
    • Best Efforts — This will show your fastest times at benchmark distances (e.g. 10km)

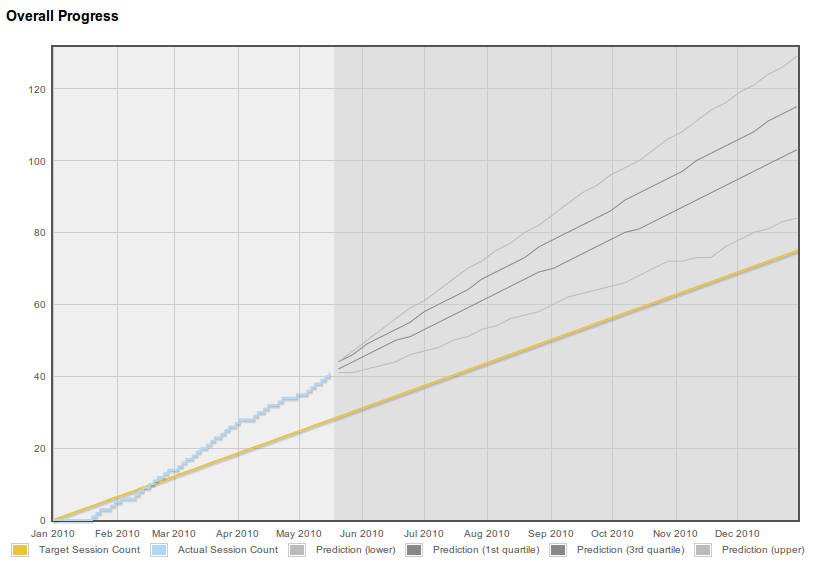
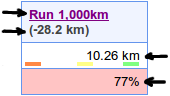
    • Goals — Progress towards a goal will be indicated as you pass 50% and 100% of your target distance, and also as you get half way through the goal period and when you complete the goal.

    • Activity counts — e.g. the 10th or 100th log for a given tag, route or distance.

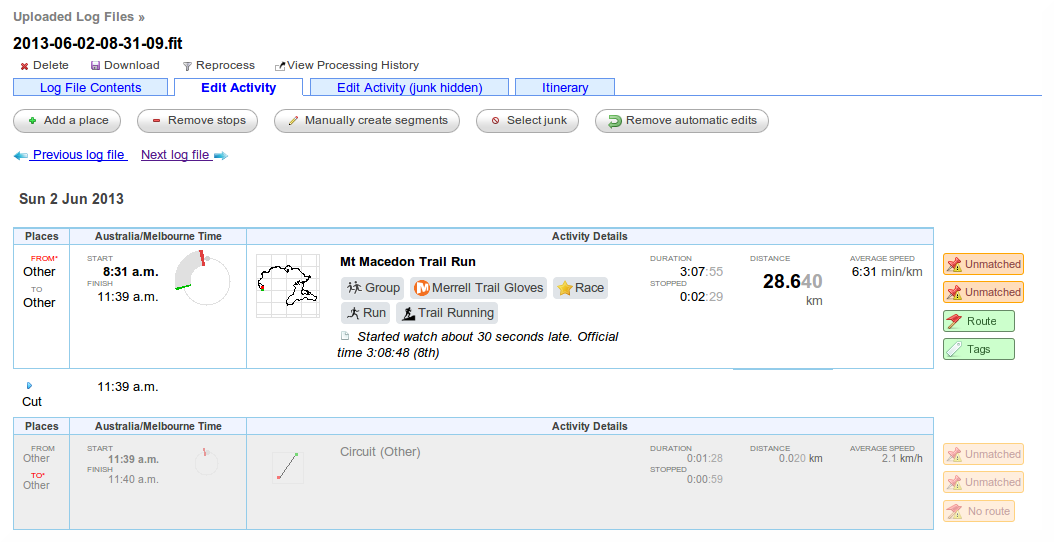
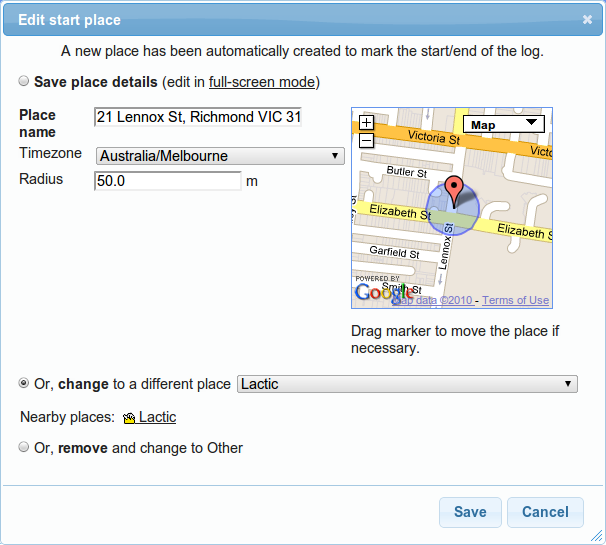
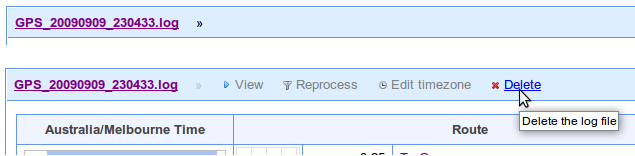
  • New layout for log file editing page:

    Hopefully this is a more logical layout that includes a few more details and removes a few things that no longer made sense. Some of the popups on this page have some small improvements too.

  • There's now a Russian translation of the help pages. Many thanks to Michael.
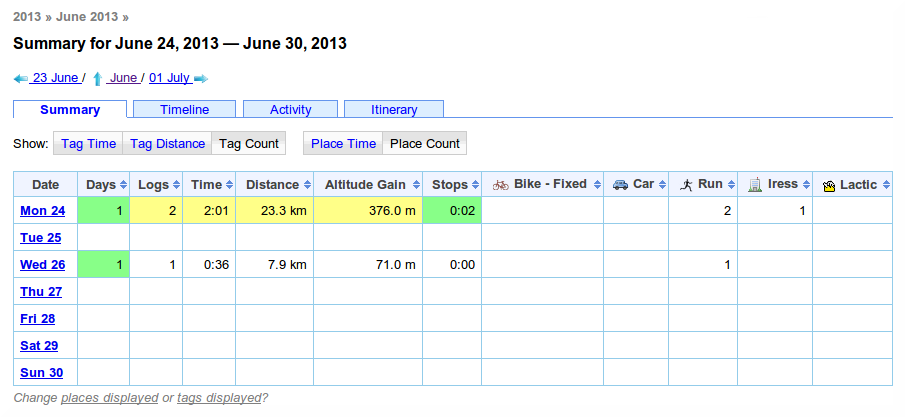
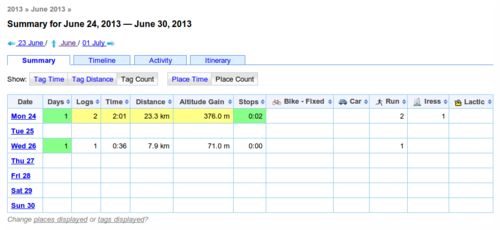
  • Added "Place Count" and "Tag Count" as options for displaying calendar summary tables.

  • Added nautical miles as an option for the distance/speed format settings.
  • Added a csv download for data from the session detail tables (e.g. from the Sessions tab on the Place or Tag detail pages.)
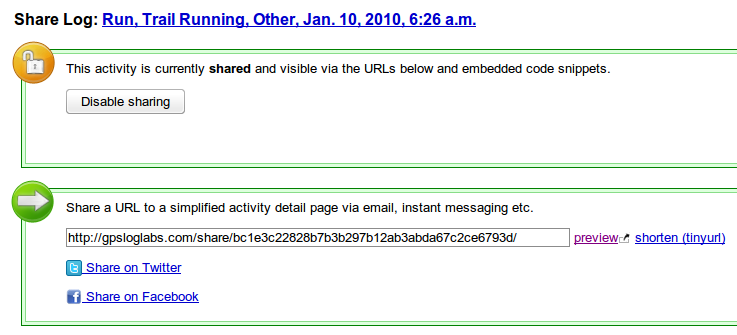
  • Fixed a bug with Facebook sharing.
Filed under  //  changelog   goals   bestefforts   activityfeed   editing   translation  

Updates for March 11th

A few little changes to note while I'm busy working on something big and pretty cool:

  • The minimum split time between checkpoints on a route has been changed from 5 minutes to 1 minute, so you can now record splits as short as laps around an oval, assuming you're not too fast that is.
  • Distances and times are now displayed with full precision in the splits detail table.
  • The mobile page now has a "Recent Uploads" list, so you can check them quickly when uploading from a phone.
  • Route "average" distances are now only shown if the logs are similar in length, otherwise the range of distances is displayed.
  • I've added columns showing the last logged date and scheduled count for routes when selecting them for goal tasks.
  • The next scheduled task for a goal is displayed in the goals table and on the summary page for quick reference.
  • The goal tasks graph now has a link to zoom it in to a view of this week.
Filed under  //  changelog   goals   splits   tasks  

Updates for February 21st

I've just added a really useful feature to GPSLog Labs: The "Comparisons" tab for an activity page now actually shows some useful comparisons in a "dashboard" format.

For each of the "standard split" distances (5 km, 5 miles, 10 km, etc.) the speed/pace and time for this log are displayed and compared to that for the other activity on the same route and/or sharing the same tags using a box plot.

The above screenshot shows the speeds for that particular run using solid dots on the box plot, and indicates it was the fastest for that route when stops are removed, but that there was a long stop somewhere between the 8 and 10 km splits that made it the slowest over those distances (the smallest value is on the left of the graphs, so rightmost is best for speed and leftmost is best for pace.)

Comparing it to all the activity tagged with Run, not just along that particular route shows it was in the top 25% (after taking out the stop):

The route comparison shows two extra splits that are not available when comparing to the tag, the total distance (10.6 km in this case) and the half-way point (5.3 km). These assume that all activity on the route is about the same length, so aren't meaningful for a tag and may also not be very useful if you have a route which varies a lot in length.

Some other recent updates to the site:

  • Pages with many tabs will have some of the tabs hidden to save space. Click the "more >>" button to show the rest.
  • The unknown routes page now lets you filter by tag.
  • When setting up a task for a goal, you can now filter the possible routes by place. This means that you can quickly find a route of the desired distance to complete the task and aren't overwhelmed by routes from places you don't need.
  • There are a couple of QR Codes on the site now to help get the urls into your mobile device. Scan the following QR code to go to the mobile version of GPSLog Labs, for example.
    Qrcode
    There is also a QR code for the unique upload email address for your device on it's detail page.
  • When adding tasks from a training program to a goal, or creating a new goal from a training program, you can now see a preview graph of the tasks involved:
  • The tag detail page has a new Splits Graph tab that shows a graph of all the activity speeds/times at standard split distances, together with lines indicating the distribution (10th, 50th, 90th percentiles).
  • The standard split distances now extend from 50km to 300km (50mi to 200mi) to make them more useful to cyclists and longer distance activities.

As always, please send feedback and suggestions to feedback forum.

Filed under  //  changelog   comparisons   goals   graphs   qr codes   splits   tasks   training program  

Updates for December 22nd

  • The "This week's activity" table on the home page of GPSLog Labs now allows you to scroll back and forward through your uploaded activity using "« Previous|This week|Next »" links. The old "Earlier activity" link has been removed as it's no longer needed.
  • The Trends report has been optimized and now runs much faster.
  • When editing an automatically created place, a list of suggested "Nearby places" is displayed to make it easier to correct logs where your logger didn't lock on at a place:
  • When editing an unmatched place, nearby places are now shown as markers on the map too. Clicking them will select the place from the drop-down list.
  • The activity detail page heading has been reformatted to make it easier to read:
    Screenshot-activity-detail-hea
  • The libraries of icons you can select from for your tags and places have been expanded and refined. They should be better looking and more useful now. Edit your tags or places to change them to one of the new icons:

    Tag icons:

    All_tags

    Place icons:

    All_places

    You can still upload your own icons if you want to, for best results they should be 16x16 pixels, in GIF or PNG format with transparent backgrounds.

  • You can now add goals based on the built in training programs. Click the Add Goal from Training Program link on the Goals page, select the program, put in your goal finish date (race/event day), select the tag you'll use to track your training logs and you're ready to go.
  • Two new training programs have been added too:
  • Adding tasks to goals has been made faster and easier too, and a bug was fixed that was preventing adding fractions of kilometers as the target distances (i.e. you could only enter whole numbers, not 6.5km for example.)

As always, feedback and suggestions are welcome and I hope everyone has a happy and safe Christmas and New Year.

Filed under  //  changelog   goals   icons   places   programs   suggested places   tags   tasks  

Updates for October 4th

Plenty of things on GPSLog Labs have been slowly improving and it's about time that I mentioned a few of them:

  • The device format detection process has been made much more robust and accurate and now has a new layout: Once the file(s) has been analysed, a summary of the results is displayed:

    Maps and graphs can be displayed if this isn't enough:

    Once a working format has been found, you can continue using the site:

    Screenshot-new_detect-4
  • Once a log is processed, there are now some illustrations on the forms to indicate the purpose of the actions:

    Merge two adjacent log segments by removing the "cut" between them

    Merge_aa_ab_ab

    Remove a stop at a place and merge the adjacent segments into a single segment

    Merge_ab_bb_bc_ac
  • The /uploads/ pages have had their urls redesigned to make the "next log file", "previous log file" and "mark as done" links work much more reliably on the different tabs. This means you can stay on the "unedited uploads only" view as you edit and tag your uploads.
  • You can now see a list of your shared activity using the mobile version of the site, also, map thumbnails have been added to the mobile view pages and there is a more obvious "view activity on map" button.
  • Goals now support planning of your future activity. You can create tasks to plan out your training program and export these in iCalendar format so you can keep track of what your plans are from MS Exchange, Google Calendar, iCal or your phone.
  • In addition to tasks, I've also added in a couple of training program templates that you can use to get started training for a marathon, half-marathon or a long distance cycling event such as the Around the Bay in a Day.

As always, I'd love to know what you think and hope you enjoy the site.

Filed under  //  changelog   devices   goals   icalendar   log formats   merge   mobile   tasks   uploading  

Distance Finish Time Predictions

I've just added an experimental feature to GPSLog Labs to provide estimates of the finish times for different distances based on the activity you've logged. For example, this can take your pace from a 10km run and tell you how long it would take to do a half marathon, or take a target pace for a long distance and tell you how fast you should be aiming to do shorter training runs.

This is based on formulas developed many years ago by Peter Riegel and Dave Cameron by fitting a curve to the world record times for various distances. How well these apply to non-elite athletes is something I'm curious about, but the theory is that if you put 100% into running 10km, you'll do it in a certain time. If you put 100% into running 5km, you'll be able to go a certain amount faster as you only have to last half as long and vice versa for 20km. The ratio of speeds at different distances should be roughly right even if you're not breaking world records.

There are two places where this now appears in GPSLog Labs, the first is on an activity detail page's Comparisons tab and it extrapolates the pace (with and without stop time taken into account) to other distances:

The estimates using the two formulas are quite close until you get to very large distances, but you will hopefully be able to judge which is more appropriate for your activity.

The second version is found on the Distance vs Time Graph tabs of the Tag detail and Goal detail pages. Move the mouse to set the speed to be extrapolated and the prediction curves will be overlayed on your actual recorded activity to see how they compare. The thin gray line is a linear prediction assuming your speed/pace won't vary as the distance increases or decreases. The red line uses Peter Riegel's model and the green line uses Dave Cameron's model. These estimates are often very similar and overlap simply appearing gray.

As far as I know, these formulas were developed for running, but the curves may be useful for other activity as well.

I'm very interested in knowing how this works for people, there are many other sites on the internet that will perform the same extrapolations if you manually key in your distance and time, so it's not just me interested in playing with this stuff!

Filed under  //  goals   graphs   predictions   stats   tags  

Goal predictions

I've just enhanced the GPSLog Labs goal overall progress graph so that it now shows a prediction of the likely result based on what you've achieved so far (hopefully that's motivating, not depressing!)

It feeds your past past weekly totals into a Monte Carlo simulator to come up with a range of possible outcomes which are added to the graph. The fainter gray lines show the upper and lower estimates, while the darkest gray lines are along the 1st and 3rd quartiles (i.e. 50% of the predicted outcomes will fall between those lines.)

This will work best for longer term goals, since it's using weeks as the unit of time, please let me know if it's not working well for your goals and I'll see what I can do.

Filed under  //  changelog   goals   graphs  

Updates for February 5th

There have been lots of little updates to GPSLog Labs since my last post and a couple of big new features that I'll preview here but will explain in full detail in future posts.

  • Translations: GPSLog Labs is now available in different languages.

    By default only day and month names will be translated, but there is a more comprehensive Polish translation thanks to Lukasz. If you want to help out translating GPSLog Labs into your language, contact me at tom@gpsloglabs.com.

    Screenshot-polish
  • Upload via email: On the detail page for your device you will be provided with an email address that you can email logs to (as attachments) and they will be processed. When they're ready you'll receive a reply with the links to your activity. This is particularly useful if you want to upload a track recorded on your iPhone using MotionX GPS app, for example.
  • Sharing: By default all your activity on GPSLog Labs is private and visible only to you, but Logs now have a Share button that lets you generate a publicly accessible detail page, such as this one.

    You can then share the URL on Twitter, Facebook, email, IM or wherever you like.

    You can also get a snippet of HTML to embed the map or graphs into your own website like this:

Filed under  //  changelog   email   goals   iphone   sharing   translation   uploading  

Updates for September 10th

This post outlines a few of the recent updates to GPSLog Labs:

  • I've added a new menu to the uploaded log files in the Inbox confirmation stage. This allows you to quickly perform tasks on the uploaded log file should you need to by simply moving the mouse over the log file heading:
  • Graphs now shade the middle two quartiles of the data, instead of showing +/- one standard deviation, where the distribution is not Gaussian. i.e. everywhere except distances along a single route. Blame Nassim Nicholas Taleb.
  • There's a Battery Cycle Duration vs Date graph on the device's Battery Life Graph tab as I was curious to see if my batteries might be deteriorating with age (they're not yet.)
  • There's a new Total Stop Time vs Date graph on the route detail Stops tab. This can show you if your amount of stopped or resting time is changing over time.
  • Goal graphs now have a dot showing the required amount to meet your target in the remaining time. The lines show the overall average so far (blue) and the average target required (orange), the dots reflect what you need to do per week/month to meet the target based on what you've done so far and how much time you have remaining:
  • Goals are now shown on the week's activity "dashboard" on home page. This lets you see at a glance how you're tracking against the goals and plan what to do next:
    Goal_homepage
    This shows: the goal title, the difference between your actual activity and the goal target to date, the total activity counting towards the goal this week, a percentage comparison to the weekly target.
    Under the total goal activity for the week are coloured indicators to show what day the activity occurred on. The most recent day is on the right in green, the oldest in orange on the left.
Filed under  //  changelog   goals   graphs   inbox  

© 2013 Tom Paton | GPSLogLabs.com | Source | Feedback | RSS | Subscribe