Updates for September 2nd
- Support for the Nav N Go iGO 8 track format has been added. This looks like a pretty good app, but has a terrible name, not that I can talk...
- Behind the scenes there's a new storage engine which will be able to handle a lot more growth in uploads. Let me know if you notice anything odd.
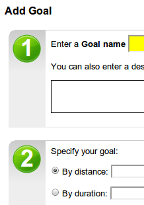
- There's a new "smoother" design on the forms throughout the
site:
- The goal detail page now has a map tab.
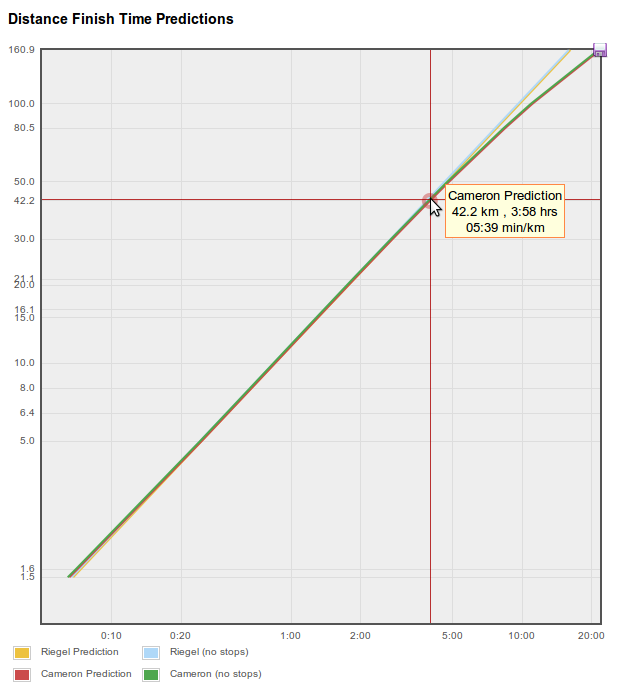
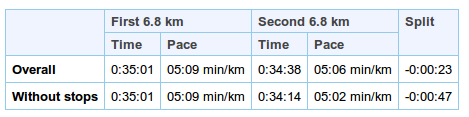
- The activity "Comparisons" tab has a new statistic: The split
for the first and second halves of the activity. The theory is that
if you've paced yourself properly and haven't slowed as you got
tired this should be 0 or even negative.
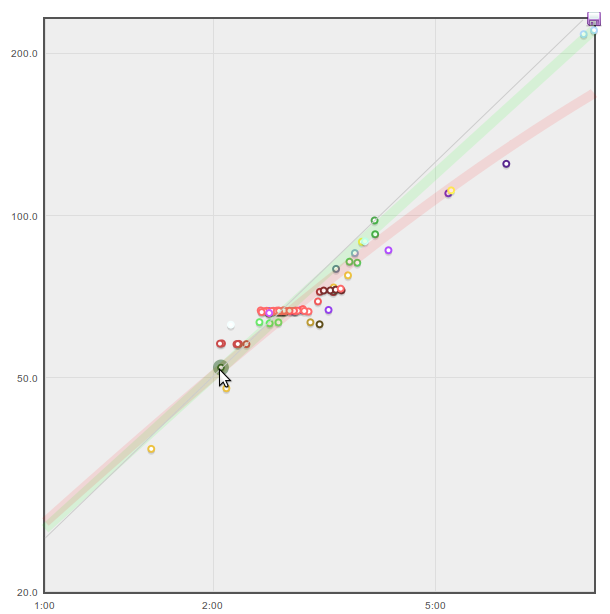
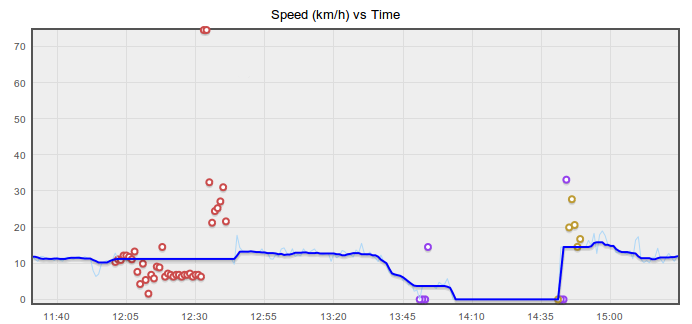
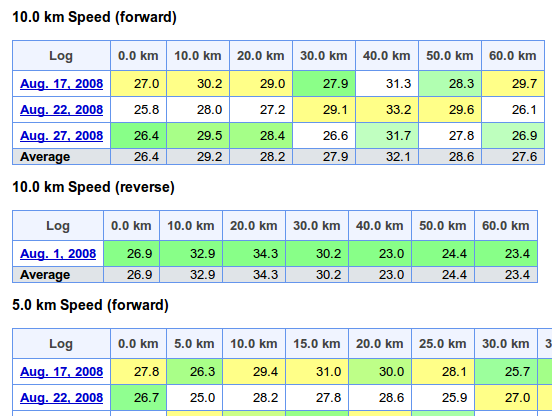
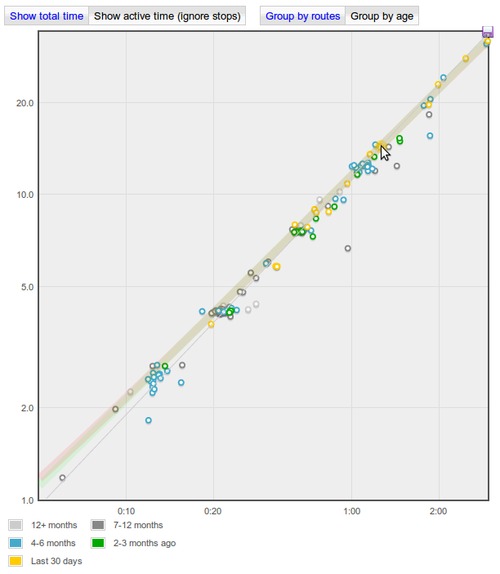
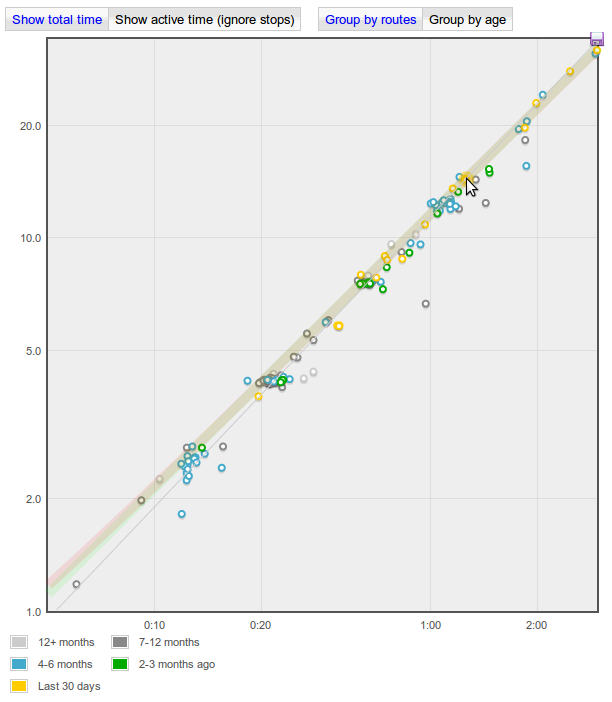
- The Distance vs Time graphs on the tag detail and goal detail
pages now have options to show the logs group by route (the
default, and previous behaviour) or by "age". This will let you see
how your performance has changed over time:
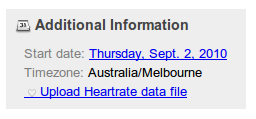
- And, finally, it's now possible to upload a heart rate data
file from a separate heart rate logger and have it stored together
with the appropriate activity.
On the activity detail page, there's a little link in the right hand side panel to "Upload Heart rate data file":
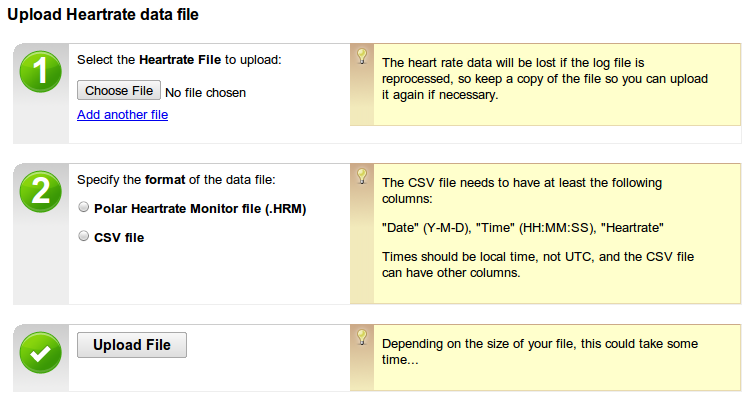
Clicking that will give you a form where you can upload one or more heart rate log files in either Polar HRM or CSV formats:
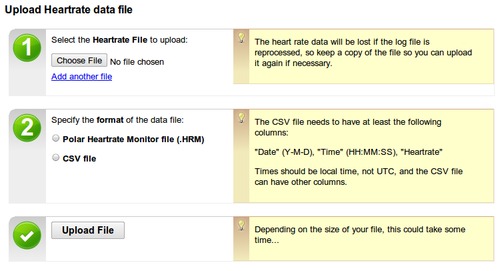
The original files aren't stored on the GPSLog Labs server though, so if you reprocess the log file (add a place, merge segments etc.) then you'll have to re-upload them.
Note that if you have enabled editing of heart rates for a tag, then the "Upload heart rate data file" link will be found on the Heart Rate tab of the activity detail page.