Updates for October 25th
Some recent updates to GPSLog Labs:
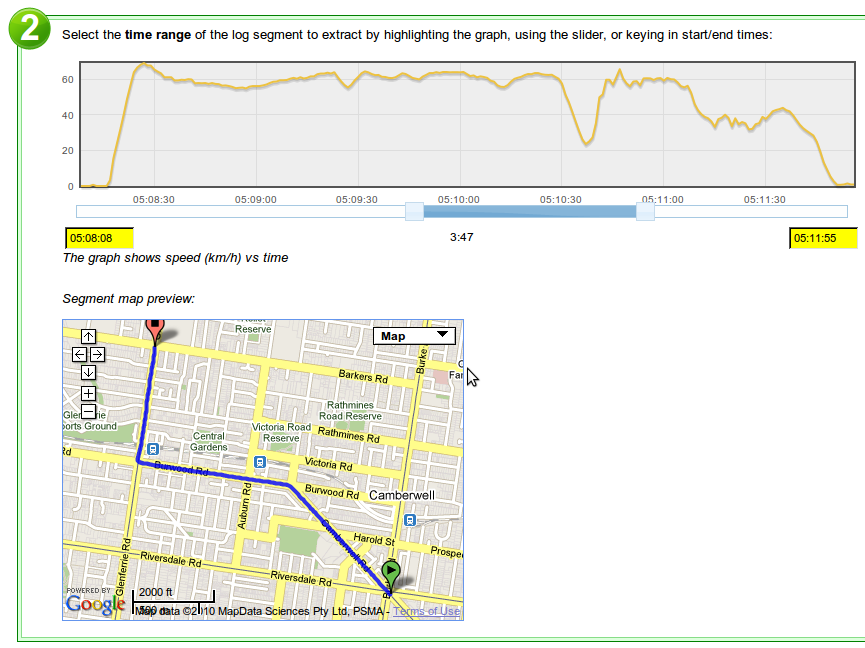
-
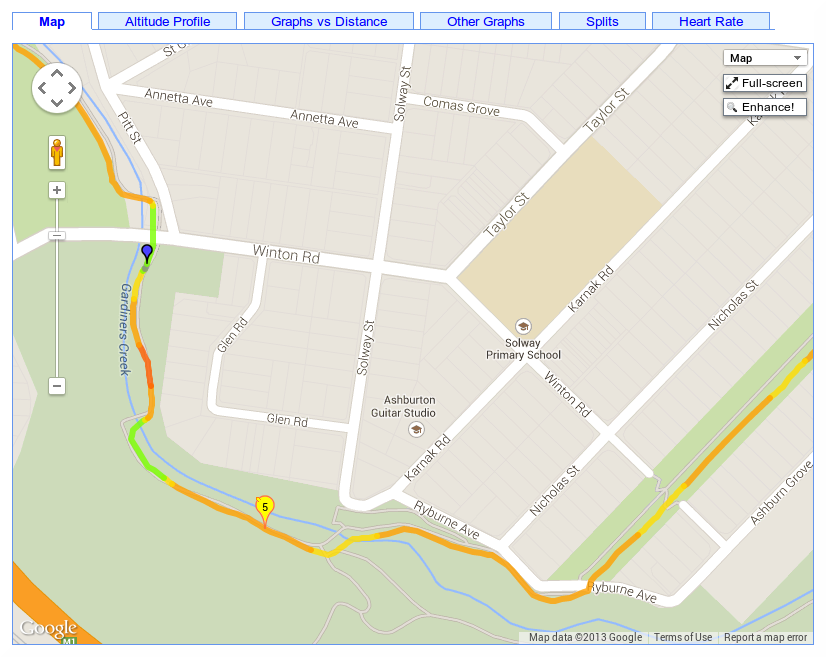
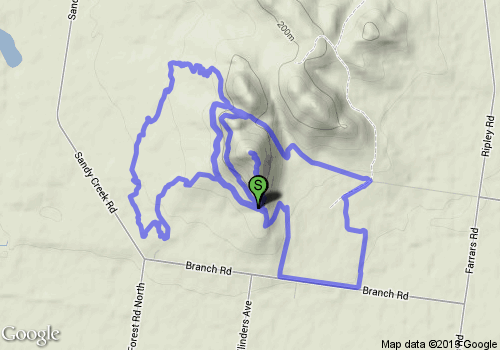
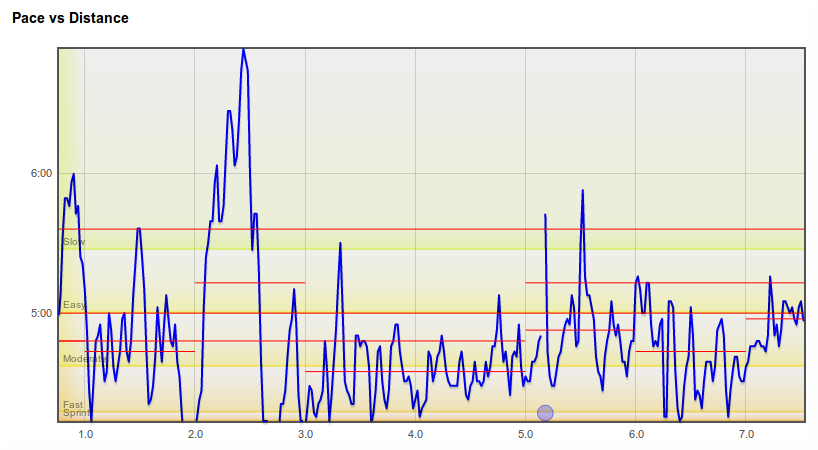
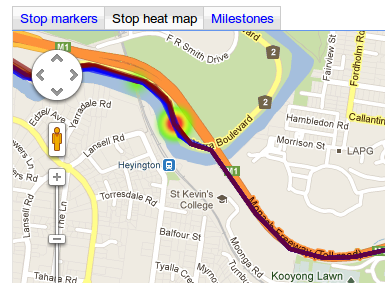
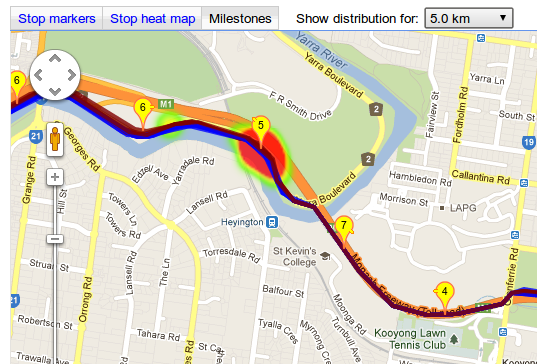
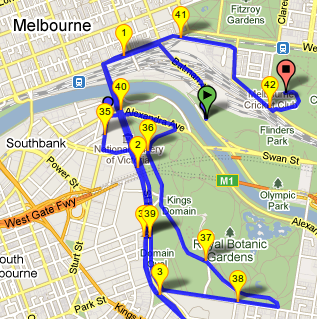
Speed zones can be displayed on maps.
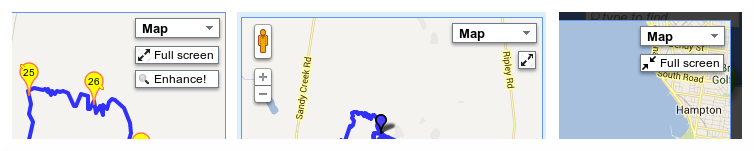
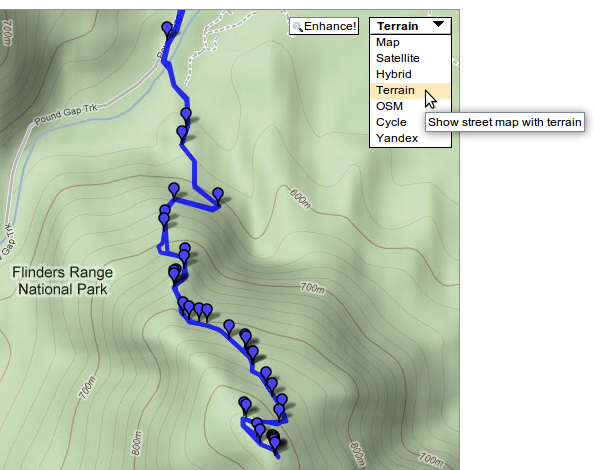
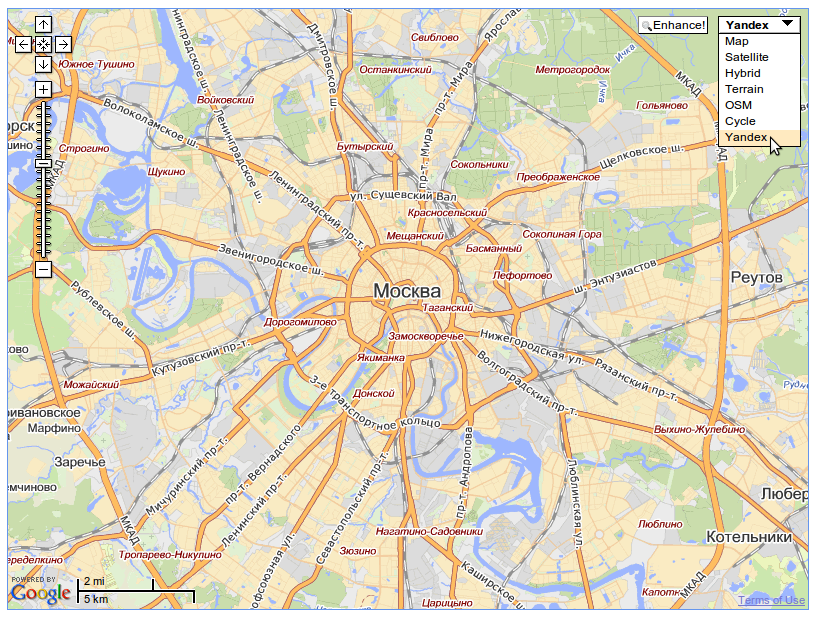
The "Enhance!" button on the maps has been converted into a dropdown menu, the old behaviour is now available from the "Unfiltered" option.
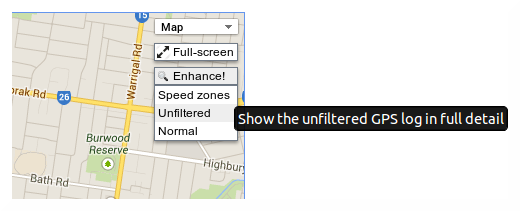
The map on the activity detail page has a new option "Speed zones" which will colour the track on the map according to the speed zone.

To enable this option, you'll need to configure speed zones for one or more of your tags.
-
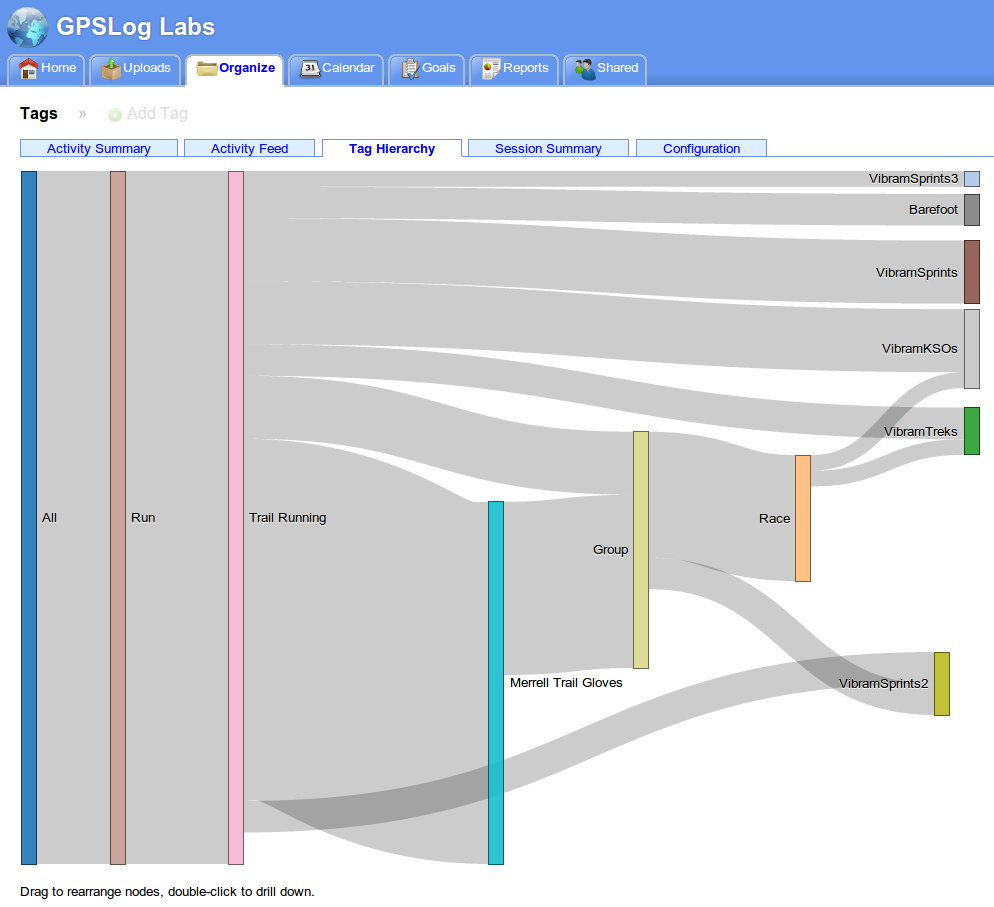
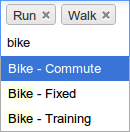
Tag hierarchy visualisation.
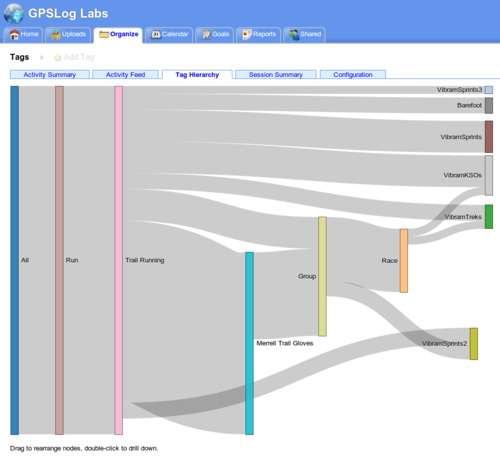
This new tab on the Tags page will automatically determine the major tags you use (Ride, Run, ...) and minor tags within those (e.g. type of shoes, bike used, type of activity.)
You can drag the tags around the graph to get a nice layout and double-click a tag to only include activity with that tag.
-
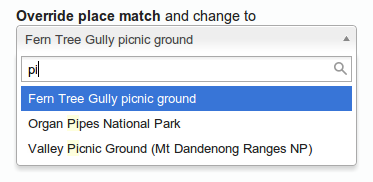
The place network visualisation now has options to sort the places according to time of first or last visit, as well as by name and count of visits.
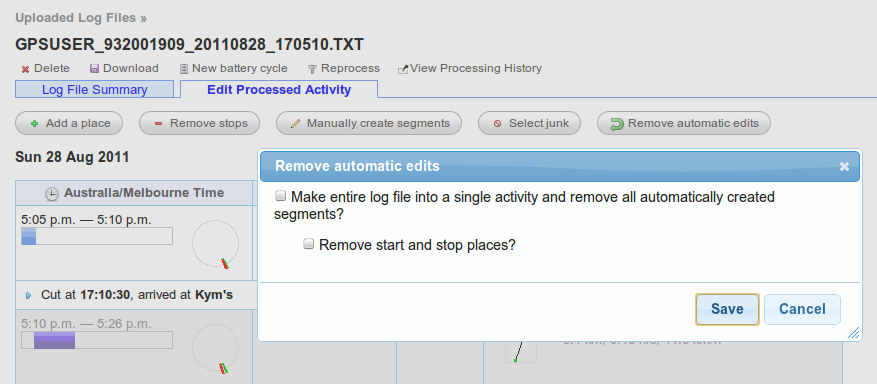
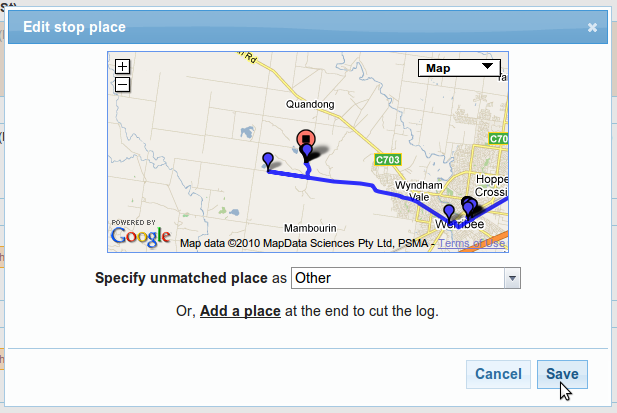
- You can once again edit activity notes directly from the log file activity editing page, rather than having to do it from the activity detail page.