GPSLog Labs Blog

GPSLog Labs Blog

New features and tips for using gpsloglabs.com

Updates for April 25th

Here are some "new" features in GPSLog Labs that I hadn't had a chance to post about yet:

  • The Tag Activity Feed is a list of completed and projected distance milestones for each tag, such as completing 1000 km (or miles):

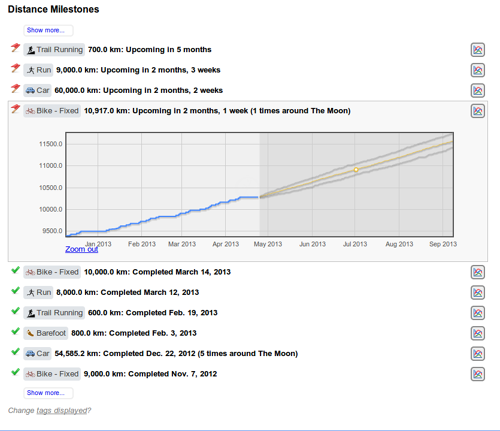
    The projections are computed with a Monte Carlo simulation based on your logged activity. The graph shows your cumulative distance and the range of likely outcomes, with the projected date taken at the median.

    A selection of these milestones may be displayed on the home page below the activity table to let you know of targets you have recently completed or will hit soon.

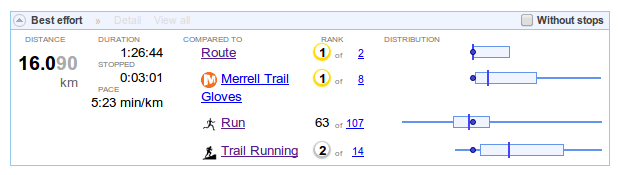
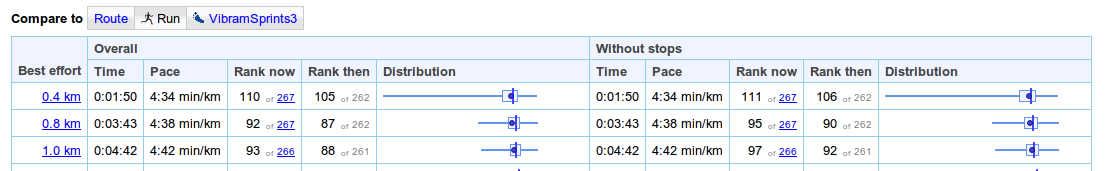
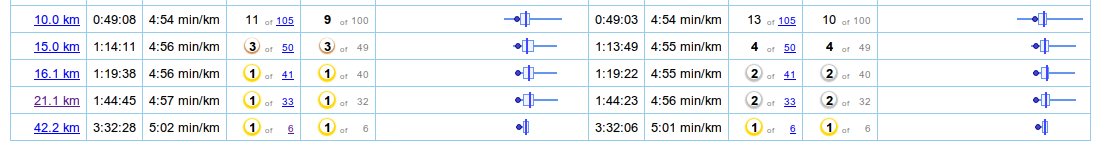
  • The log detail page now shows the longest best effort at the top of the page:

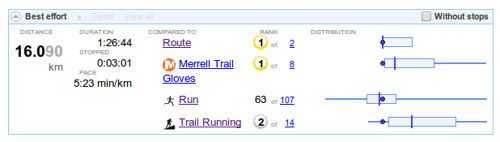
    This lets you see at a glance how well the activity compares to others with the same tag and on the same route, and you can click through to view the other distances on the Comparisons tab.

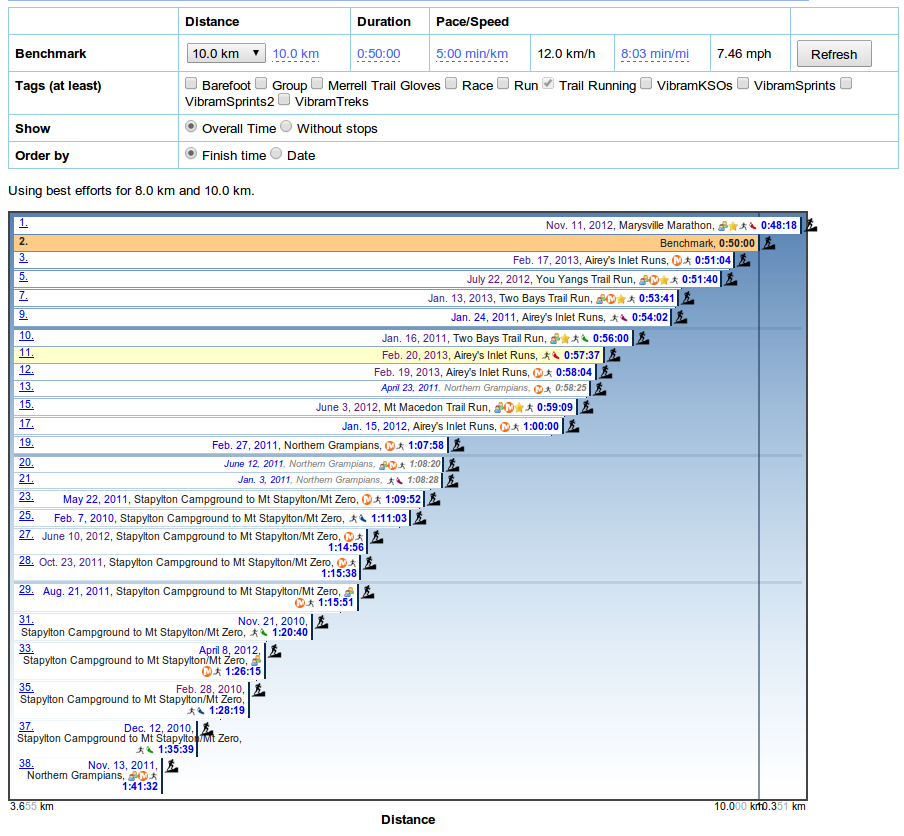
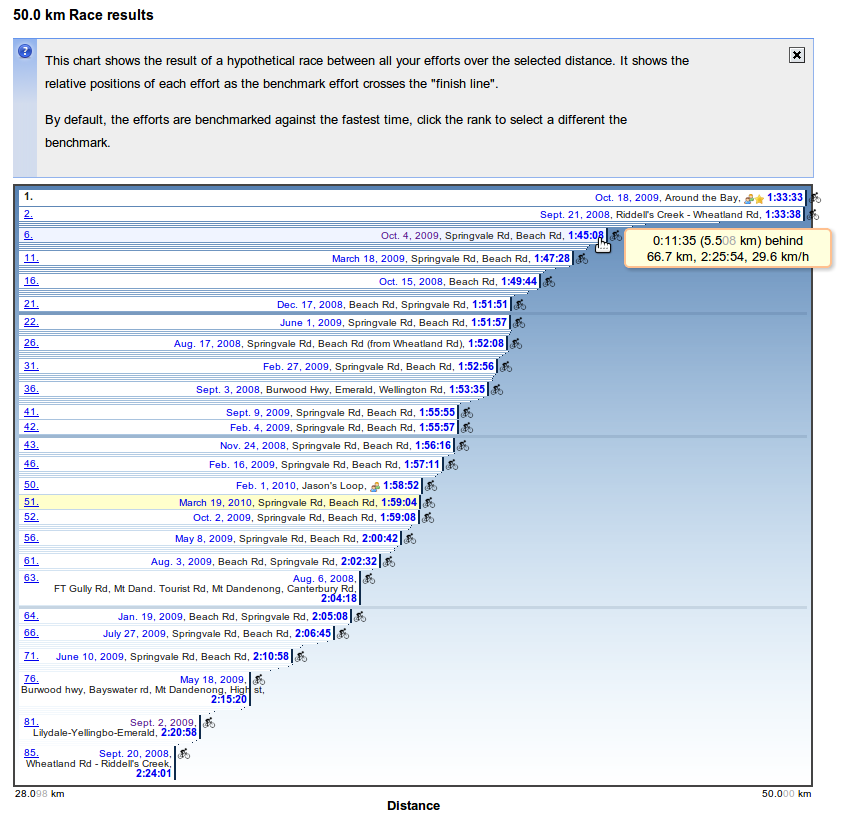
  • The Virtual Race allows you to see the result of a hypothetical race between all your efforts for a particular set of tags.

    You can find the Virtual Race tab on the tag detail page, and there you can select a distance and a target time or speed and the relative positions of each effort as the benchmark effort crosses the "finish line" will be shown.

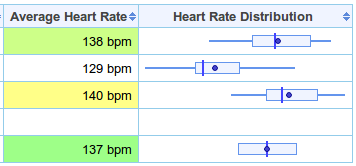
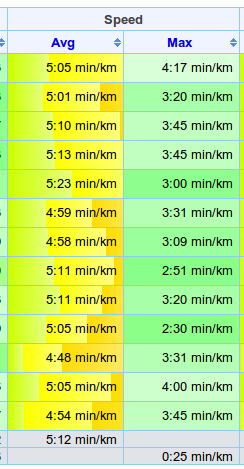
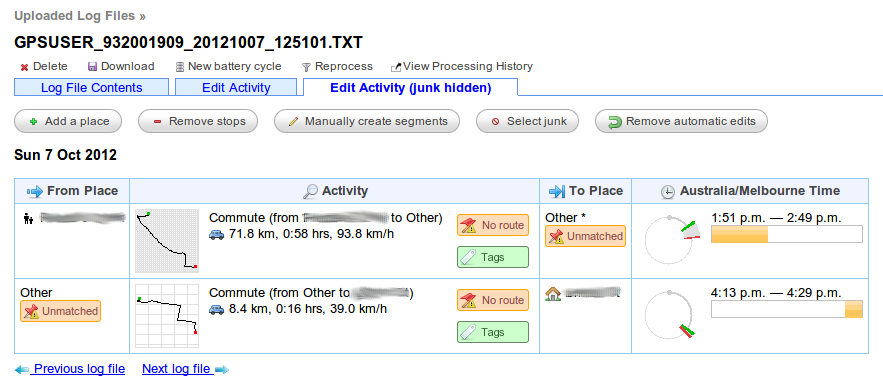
  • The activity table details section has a cleaner layout:

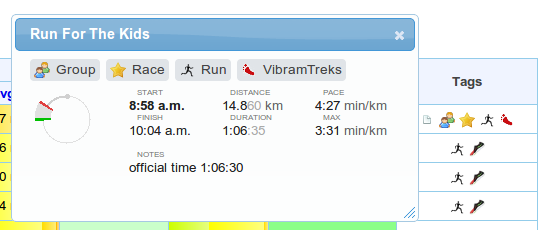
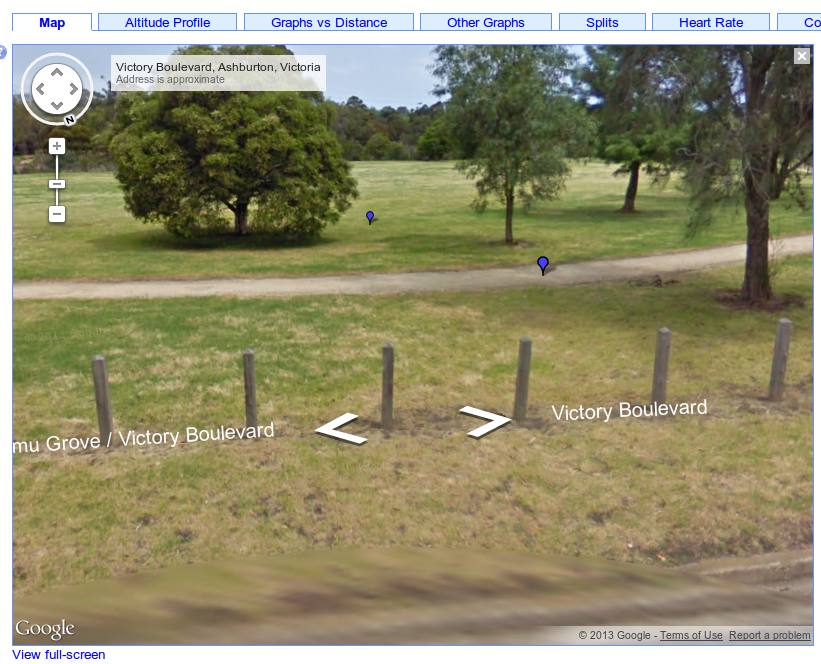
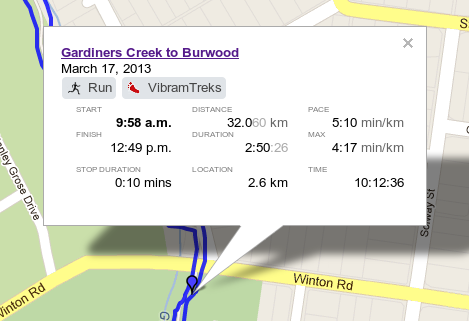
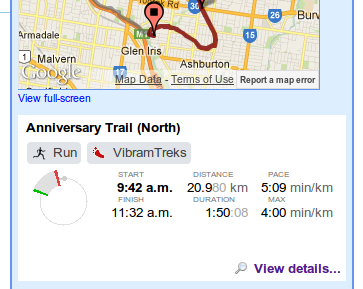
  • Activity notes popups have been expanded to show more details, and you can now have more than one open at a time:

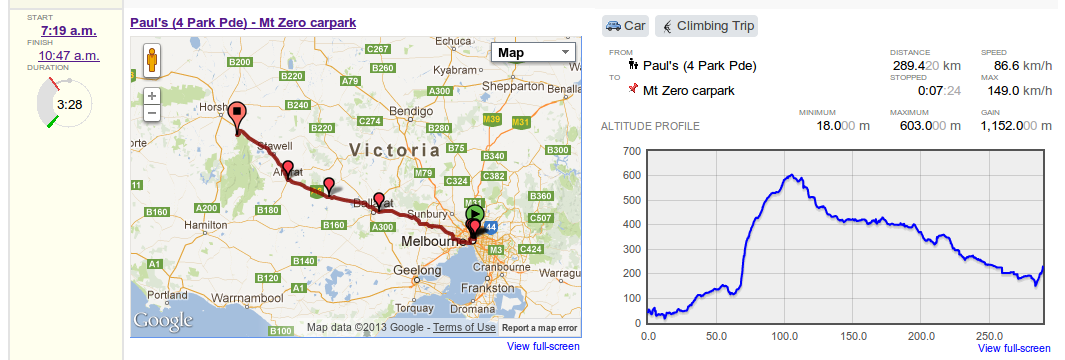
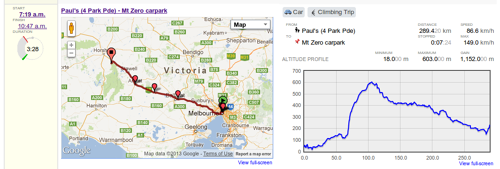
  • The Log File detail page has a new Itinerary tab, and the Itinerary tabs throughout the site have a nicer, cleaner layout:

  • Also, I've fixed some problems that occurred when uploading zip files with non-English file names.

Filed under  //  changelog   bestefforts   itinerary   race results   activityfeed  

New blog

Thanks to Posterous shutting down, I've had to spend a lot of my time recently coming up with a new blog. Thanks Roberto and collaborators for the nifty Nikola engine.

You may notice a few changes in the layout, but the main difference is there are no longer comments on each post. These never got a lot of use anyway, the best place to comment is and always was the feedback forum.

The second change is to the email newsletter. I've tried to keep everyone subscribed, but I apologize in advance if anyone has been dropped off or added back onto the list after they unsubscribed.

Filed under  //  changelog   documentation   feedback  

Fixed maps (was broken for some languages)

I've just fixed up a localisation bug that was breaking the maps in some languages. If you were having problems, please give it another go and I'm sorry for the inconvenience.

Filed under  //  changelog   maps   translation  

New Google maps

GPSLog Labs has finally be updated to use the latest Google Maps (v3 for those keeping score.)

Please keep an eye out for anything that may have been broken in the change over and let me know if you see anything.

I hope you enjoy some of the shiny new features, including:

  • Maps are now much faster!
  • You can use streetview to checkout your activities from ground-level.
  • In some areas, the satellite photography has funky 45 degree images.
  • The info popups have some nicer formatting
    21
  • Maps for routes have a couple of modes to show a heatmap of stops along the route:
    56
    And also the location of the milestones:
  • New icons are available in the tag and place icon libraries (courtesy of Mapbox)
  • The map of all the users' places has been changed from using markers to a heatmap (and has some animation.)
  • Paths on selection maps can be coloured according to route or with unique colours.

Bundled in with these changes you'll find a bunch of other improvements and new features that I'll cover in the next post.

Filed under  //  changelog   maps   milestones  

Call for assistance: Yandex map layers in Google Maps API v3 [Solved]

I'm currently upgrading GPSLog Labs to use Google Maps v3 and have a problem with the Yandex map layer.

I've set up some sample code here: http://jsfiddle.net/VkGjq/1/

Note that the map layers don't line up when switching between Google road map layer and the Yandex layer.

Does anyone know how to make this work? Yandex layers are something many GPSLog Labs users are taking advantage of, and I would hate to lose that feature when migrating to Google Maps v3.

UPDATE: I got it working (http://jsfiddle.net/VkGjq/2/), Google Maps v3 support will be released soon I hope!

[Completed] Scheduled Maintenance 3-Feb-2013 3:00 UTC

The GPSLog Labs server will be down for maintenance on Sunday 3rd February, from approximately 3:00 UTC to 5:00 UTC.

The site will be unavailable while this occurs, sorry for any inconvenience that may cause.

Updates for January 7th

I've made a few more changes to GPSLog Labs to better support heart rate logging:

  • Heart rate data can now be filtered!

    These filters work in the same way as the other GPS data filters and can be added to individual logs or to tags so they are added automatically.

    There are 3 heart rate filters, one takes the median heart rate, one the average (mean) heart rate and the last one is a special filter to clean up noisy heart rate data during your warm-up where the heart rate strap doesn't record properly until you've built up a bit of a sweat.

    Gpsloglabs_-_gps_data_filters

    You put in a "warm up time" (7 minutes in the above image) and it will discard any readings that are too high during that period. It assumes your heart rate after you've warmed up is higher than when you're warming up which is pretty rough, but it cleans up a lot of messy data.

  • Additional heart rate log files can be uploaded in .zip files
  • The tag detail page summary tab now has "box whisker" plots for the heart rate distributions
    Gpsloglabs_-_run_summary

Some other recent changes include:

  • Speed zones
    Gpsloglabs_-_run_zones

    These are configured per tag like heart rate training zones and will be displayed in the background of the activity tables to give you an indication of the intensity of the activity.

  • The Speed Average filter has been changed from an exponential average to a regular mean, so it no longer "lags" behind the signal.
  • The Speed Median and Speed Average filters have also had a cutoff added to preserve stops, any data below that threshold won't be filtered.
  • The GPSLog Labs home page has a new layout that highlights some key features a little more prominently.
  • Alert & confirm popups use the alertify.js library.
  • Support for the Garmin FIT file format has been added.
Filed under  //  changelog   filters   heartrate  

Heart rate graphs

The heart rate analysis features of GPSLog Labs have had some big updates:

Firstly, you can now set up heart rate training zones for each tag.

Each zone can have a name and an upper heart rate, to assist configuring the zones, you can set your resting and maximum heart rates and the percentage of your heart rate reserve (maximum - rest) for each zone is displayed.

Once these are set up, you can see breakdowns of the time in each zone on the activity detail heart rate tab:

Screenshot-log_hr_zones_table
Screenshot-log_hr_zones_detail

And best of all, on the activity tables for a log or route, the proportions of time in each heart rate zone are shown as colours in the background of the table cell:

Screenshot-hr_zones_table_bg

To assist in calculating your heart rate zones, I've also created a maximum heart rate calculator page. This page is accessible without a GPSLog Labs account and might help you wade through the mass of different formulas for calculating a maximum heart rate that are out there (or at least the ones on the Wikipedia page.)

It's been possible for a while now to upload additional heart rate data for an activity. This allows you to use a stand-alone heart rate logger (such as a Polar HRM) if your GPS logger doesn't record heart rate directly.

The upload process has been made more flexible, it now imports data from more formats (such as GPX and Garmin Training Centre TCX) and will automatically detect the format.

The uploaded heart rate files are now stored together with the log files and will be automatically reapplied after processing or editing filters.

There's a new tab on the uploaded log file page where the heart rate data can be previewed and downloaded or removed too if necessary.

Heart rate data can also be uploaded for manual entries, for example for data logged on a treadmill or wind-trainer.

Filed under  //  changelog   graphs   heartrate   tags  

Updates for October 17th

The last few months have seen some minor updates to GPSLog Labs and a bunch of major heart rate logging related features that will be in a post of their own.

  • "Race results". This is a new visualisation available on the Best Efforts tab for Tags and Routes.
    It takes the best efforts at a given distance from all of your activity and shows a "photo finish" of where each log would be as the "winner" crossed the line.
    Choose the distance to be compared by clicking on the column headings of the best efforts table.
    Some of the results may be collapsed so the chart doesn't take up too much space.
  • Together with the "Race results" there's also a histogram of Average Speed/Pace.
    It's actually a few histograms overlayed, the darkest bars are the count from the last few months, the lightest the count for all time. This means you can see if there's a pattern to your recent activity that differs from the rest.
  • The Uploaded log file page has a new tab, Edit Activity (junk hidden) that lets you edit the places & tags without being distracted by the junk segments and merge points.
  • There's a new "Remove Stops" filter to clean up maps of hikes or walks where otherwise there would be too many stop markers.
    This is a bit of a hack, but it allows you to filter out stops which are shorter than the threshold. Unfortunately it does that by substituting a speed of 1km/h during the stop, which will mess with the average speed stats, so this filter should only be used where those stats are not too important.
  • The Tag map now has an option to show log colours "By route" or "By direction". Choosing "By route" can help find logs that may have been mis-classified or to find logs that could be grouped together into a new route.
Filed under  //  changelog   filters   race results  

Updates for July 14th

Some big changes have been made to how your uploaded log files are processed. Hopefully this should handle big files a bit better than before, but other than that there shouldn't be any noticeable differences. No doubt some little bugs will have crept in however, so if you notice anything weird, please let me know.

There have been a few other minor changes too:

  • The best effort tables now have two rankings displayed. One is the rank at the time of the activity ("rank then"), and the other is the rank of the activity for all time ("rank now").

  • And the 1st through 9th places in rankings get a pretty highlight:

  • A table of best effort times/speeds has also been added to the shared activity page.
  • The activity detail page's summary table now has a nicer layout too:

  • Lastly, there was a bug dragging and dropping tasks on the goal calendar which is now fixed and working properly again.
Filed under  //  bestefforts   changelog   processing  
← Newer posts Older posts →

© 2013 Tom Paton | GPSLogLabs.com | Source | Feedback | RSS | Subscribe