Goal predictions
I've just enhanced the GPSLog Labs goal overall progress graph so that it now shows a prediction of the likely result based on what you've achieved so far (hopefully that's motivating, not depressing!)
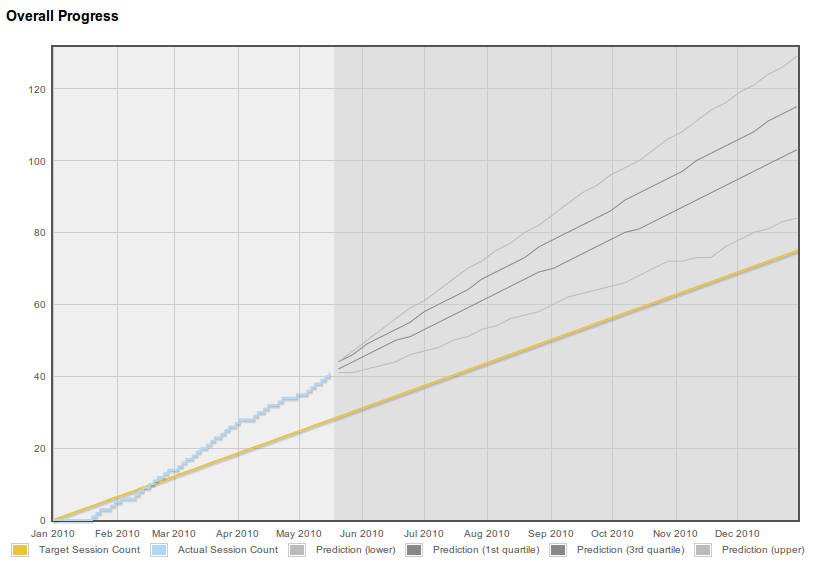
It feeds your past past weekly totals into a Monte Carlo simulator to come up with a range of possible outcomes which are added to the graph. The fainter gray lines show the upper and lower estimates, while the darkest gray lines are along the 1st and 3rd quartiles (i.e. 50% of the predicted outcomes will fall between those lines.)
This will work best for longer term goals, since it's using weeks as the unit of time, please let me know if it's not working well for your goals and I'll see what I can do.
| ← Previous post | Next post → |